Activity
Create a set of data points that has this histogram. (You can do it with a short list of whole numbers.)
What are its mean and median?
# Set up packages for lecture. Don't worry about understanding this code, but
# make sure to run it if you're following along.
import numpy as np
import babypandas as bpd
import pandas as pd
from matplotlib_inline.backend_inline import set_matplotlib_formats
import matplotlib.pyplot as plt
set_matplotlib_formats("svg")
plt.style.use('ggplot')

np.set_printoptions(threshold=20, precision=2, suppress=True)
pd.set_option("display.max_rows", 7)
pd.set_option("display.max_columns", 8)
pd.set_option("display.precision", 2)

# Animations
from IPython.display import display, IFrame

def show_confidence_interval_slides():
    src="https://docs.google.com/presentation/d/e/2PACX-1vTaPZsueXI6fey_5cj2Y1TevkR1joBvpwaWVsZNvgBlnJSrw1EiBLHJywkFH_QNLU5Tdr6JZgDrhFxG/embed?start=false&loop=false&delayms=3000"
    width = 960
    height = 989
    display(IFrame(src, width, height))
Let's rerun our code from last time to compute a 95% confidence interval for the median salary of all San Diego city employees, based on a sample of 500 people.
Step 1: Collect a single sample of size 500 from the population.
np.random.seed(38) # Magic to ensure that we get the same results every time this code is run.

population = bpd.read_csv('data/2021_salaries.csv').get(['TotalWages'])
population_median = population.get('TotalWages').median()

my_sample = population.sample(500)
sample_median = my_sample.get('TotalWages').median()
sample_median
72016.0
Step 2: Bootstrap! That is, resample from the sample a large number of times, and each time, compute the median of the resample. This will generate an empirical distribution of the sample median.
np.random.seed(38)

# Bootstrap the sample to get more sample medians.
n_resamples = 5000
boot_medians = np.array([])

for i in np.arange(n_resamples):
    resample = my_sample.sample(500, replace=True)
    median = resample.get('TotalWages').median()
    boot_medians = np.append(boot_medians, median)

boot_medians
array([74261. , 73080. , 72486. , ..., 68216. , 76159. , 69768.5])
Step 3: Take the middle 95% of the empirical distribution of sample medians (i.e. boot_medians). This creates our 95% confidence interval.
left = np.percentile(boot_medians, 2.5)
right = np.percentile(boot_medians, 97.5)

# Therefore, our interval is:
[left, right]
[66987.0, 76527.0]
bpd.DataFrame().assign(BootstrapMedians=boot_medians).plot(kind='hist', density=True, bins=np.arange(60000, 85000, 1000), ec='w', figsize=(10, 5))
plt.plot([left, right], [0, 0], color='gold', linewidth=12, label='95% confidence interval');
plt.scatter(population_median, 0.000004, color='blue', s=100, label='population median').set_zorder(3)
plt.legend();
Now, instead of saying
We think the population median is close to our sample median, \$72,016.
We can say:
A 95% confidence interval for the population median is \$66,987 to \\$76,527.
Today, we'll address: What does 95% confidence mean? What are we confident about? Is this technique always "good"?
many_cis below.many_cis = np.load('data/many_cis.npy')
many_cis
array([[70247.  , 80075.68],
       [63787.65, 75957.5 ],
       [71493.  , 82207.5 ],
       ...,
       [66679.64, 81308.  ],
       [65735.68, 80060.21],
       [69756.1 , 80383.5 ]])
In the visualization below,
plt.figure(figsize=(10, 6))
for i, ci in enumerate(many_cis):
    plt.plot([ci[0], ci[1]], [i, i], color='gold', linewidth=2)
plt.axvline(x=population_median, color='blue');
plt.figure(figsize=(10, 6))
count_outside = 0
for i, ci in enumerate(many_cis):
    if ci[0] > population_median or ci[1] < population_median:
        plt.plot([ci[0], ci[1]], [i, i], color='gold', linewidth=2)
        count_outside = count_outside + 1
plt.axvline(x=population_median, color='blue');
count_outside
11
Confidence intervals can be hard to interpret.
# Our interval:
[left, right]
[66987.0, 76527.0]
Does this interval contain 95% of all salaries? No! ❌
However, this interval does contain 95% of all bootstrapped median salaries.
population.plot(kind='hist', y='TotalWages', density=True, ec='w', figsize=(10, 5))
plt.plot([left, right], [0, 0], color='gold', linewidth=12, label='95% confidence interval');
plt.legend();
# Our interval:
[left, right]
[66987.0, 76527.0]
Is there is a 95% chance that this interval contains the population parameter? No! ❌
Why not?
show_confidence_interval_slides()
my_sample.n_resamples = 5000
boot_maxes = np.array([])
for i in range(n_resamples):
resample = my_sample.sample(my_sample.shape[0], replace=True)
boot_max = resample.get('TotalWages').max()
boot_maxes = np.append(boot_maxes, boot_max)
boot_maxes
array([235709., 329949., 247093., ..., 329949., 329949., 235709.])
Since we have access to the population, we can find the population maximum directly, without bootstrapping.
population_max = population.get('TotalWages').max()
population_max
359138
Does the population maximum lie within the bulk of the bootstrapped distribution?
bpd.DataFrame().assign(BootstrapMax=boot_maxes).plot(kind='hist',
                                                     density=True,
                                                     bins=10,
                                                     ec='w',
                                                     figsize=(10, 5))
plt.scatter(population_max, 0.0000008, color='blue', s=100, label='population max')
plt.legend();
No, the bootstrapped distribution doesn't capture the population maximum (blue dot) of \$359,138. Why not? 🤔
my_sample.get('TotalWages').max()
329949
It turns out that we can use bootstrapped confidence intervals for hypothesis testing!
population = bpd.read_csv('data/2021_salaries.csv')
fire_rescue_population = population[population.get('DepartmentOrSubdivision') == 'Fire-Rescue']
fire_rescue_population
| Year | EmployerType | EmployerName | DepartmentOrSubdivision | ... | EmployerCounty | SpecialDistrictActivities | IncludesUnfundedLiability | SpecialDistrictType | |
|---|---|---|---|---|---|---|---|---|---|
| 4 | 2021 | City | San Diego | Fire-Rescue | ... | San Diego | NaN | False | NaN |
| 5 | 2021 | City | San Diego | Fire-Rescue | ... | San Diego | NaN | False | NaN |
| 6 | 2021 | City | San Diego | Fire-Rescue | ... | San Diego | NaN | False | NaN |
| ... | ... | ... | ... | ... | ... | ... | ... | ... | ... |
| 12301 | 2021 | City | San Diego | Fire-Rescue | ... | San Diego | NaN | False | NaN |
| 12302 | 2021 | City | San Diego | Fire-Rescue | ... | San Diego | NaN | False | NaN |
| 12304 | 2021 | City | San Diego | Fire-Rescue | ... | San Diego | NaN | False | NaN |
1621 rows × 29 columns
# The median salary of all City of SD employees, in all departments.
population_median = population.get('TotalWages').median()
population_median
74441.0
np.random.seed(38)

fire_rescue_sample = fire_rescue_population.sample(300)
fire_rescue_sample
| Year | EmployerType | EmployerName | DepartmentOrSubdivision | ... | EmployerCounty | SpecialDistrictActivities | IncludesUnfundedLiability | SpecialDistrictType | |
|---|---|---|---|---|---|---|---|---|---|
| 6762 | 2021 | City | San Diego | Fire-Rescue | ... | San Diego | NaN | False | NaN |
| 8754 | 2021 | City | San Diego | Fire-Rescue | ... | San Diego | NaN | False | NaN |
| 3783 | 2021 | City | San Diego | Fire-Rescue | ... | San Diego | NaN | False | NaN |
| ... | ... | ... | ... | ... | ... | ... | ... | ... | ... |
| 10812 | 2021 | City | San Diego | Fire-Rescue | ... | San Diego | NaN | False | NaN |
| 11112 | 2021 | City | San Diego | Fire-Rescue | ... | San Diego | NaN | False | NaN |
| 11009 | 2021 | City | San Diego | Fire-Rescue | ... | San Diego | NaN | False | NaN |
300 rows × 29 columns
np.percentile.n_resamples = 500
fire_rescue_medians = np.array([])
for i in range(n_resamples):
# Resample from fire_rescue_sample.
resample = fire_rescue_sample.sample(300, replace=True)
# Compute the median.
median = resample.get('TotalWages').median()
# Add it to our array of bootstrapped medians.
fire_rescue_medians = np.append(fire_rescue_medians, median)
fire_rescue_medians
array([ 90959. , 100759. , 92676. , ..., 95701.5, 94562. , 99148. ])
fire_left = np.percentile(fire_rescue_medians, 0.5)
fire_left
82766.5
fire_right = np.percentile(fire_rescue_medians, 99.5)
fire_right
108676.585
# Resulting interval:
[fire_left, fire_right]
[82766.5, 108676.585]
Is \$74,441 in this interval? No. ❌
bpd.DataFrame().assign(FireRescueBootstrapMedians=fire_rescue_medians).plot(kind='hist', density=True, bins=np.arange(75000, 125000, 1000), ec='w', figsize=(10, 5))
plt.plot([fire_left, fire_right], [0, 0], color='gold', linewidth=12, label='99% confidence interval');
plt.legend();
# Actual population median of Fire-Rescue Department salaries:
fire_rescue_population.get('TotalWages').median()
97388.0
The mean is a one-number summary of a set of numbers. For example, the mean of $2, 3, 3,$ and $9$ is $\frac{2 + 3 + 3 + 9}{4} = 4.25$.
Observe that the mean:
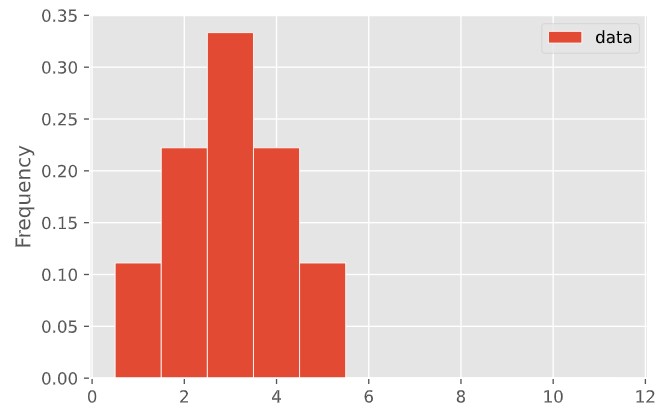
Create a set of data points that has this histogram. (You can do it with a short list of whole numbers.)
What are its mean and median?
| |
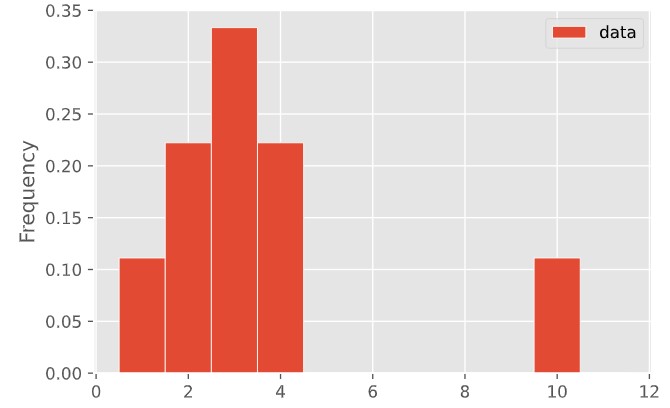 |
Are the means of these two distributions the same or different? What about the medians?
delays = bpd.read_csv('data/delays.csv')
delays.plot(kind='hist', y='Delay', bins=np.arange(-20.5, 210, 5), density=True, ec='w', figsize=(10, 5))
plt.title('Flight Delays')
plt.xlabel('Delay (minutes)');
Question: Which is larger – the mean or the median?
delays.get('Delay').mean()
16.658155515370705
delays.get('Delay').median()
2.0
delays.plot(kind='hist', y='Delay', bins=np.arange(-20.5, 210, 5), density=True, ec='w', alpha=0.65, figsize=(10, 5))
plt.plot([delays.get('Delay').mean(), delays.get('Delay').mean()], [0, 1], color='green', label='Mean')
plt.scatter([delays.get('Delay').mean()], [-0.0017], color='green', marker='^', s=250)
plt.plot([delays.get('Delay').median(), delays.get('Delay').median()], [0, 1], color='purple', label='Median')
plt.title('Flight Delays')
plt.xlabel('Delay (minutes)')
plt.ylim(-0.005, 0.065)
plt.legend();
data = np.array([2, 3, 3, 9])
np.mean(data)
4.25
deviations = data - np.mean(data)
deviations
array([-2.25, -1.25, -1.25, 4.75])
Each entry in deviations describes how far the corresponding element in data is from 4.25.
What is the average deviation?
np.mean(deviations)
0.0
# Square all the deviations:
deviations ** 2
array([ 5.06, 1.56, 1.56, 22.56])
variance = np.mean(deviations ** 2)
variance
7.6875
This quantity, the average squared deviation from the mean, is called the variance.
# Standard deviation (SD) is the square root of the variance.
sd = variance ** 0.5
sd
2.7726341266023544
numpy has a function, np.std, that calculates the standard deviation for us.# Note that this evaluates to the same number we found on the previous slide.
np.std(data)
2.7726341266023544
To summarize:
$$\begin{align*}\text{variance} &= \text{average squared deviation from the mean}\\ &= \frac{(\text{value}_1 - \text{mean})^2 + ... + (\text{value}_n - \text{mean})^2}{n}\\ \text{standard deviation} &= \sqrt{\text{variance}} \end{align*}$$where $n$ is the number of observations.
It turns out, no matter what the shape of the distribution is, the bulk of the data are in the range “average ± a few SDs”.
More on this next class!