
# Set up packages for lecture. Don't worry about understanding this code,
# but make sure to run it if you're following along.
import numpy as np
import babypandas as bpd
import pandas as pd
from matplotlib_inline.backend_inline import set_matplotlib_formats
import matplotlib.pyplot as plt
set_matplotlib_formats("svg")
plt.style.use('ggplot')

np.set_printoptions(threshold=20, precision=2, suppress=True)
pd.set_option("display.max_rows", 7)
pd.set_option("display.max_columns", 8)
pd.set_option("display.precision", 2)
A model is a set of assumptions about how data was generated.
"... the overall percentage disparity has been small...”
np.random.choice won't help us, because we don't know how large the eligible population is.np.random.multinomial helps us sample at random from a categorical distribution.np.random.multinomial(sample_size, pop_distribution)
np.random.multinomial samples at random from the population, with replacement, and returns a random array containing counts in each category.pop_distribution needs to be an array containing the probabilities of each category.Aside: Example usage of np.random.multinomial
On Halloween 👻 you'll trick-or-treat at 35 houses, each of which has an identical candy box, containing:
At each house, you'll select one candy blindly from the candy box.
To simulate the act of going to 35 houses, we can use np.random.multinomial:
np.random.multinomial(35, [0.3, 0.3, 0.4])
array([ 9, 10, 16])
In our case, a randomly selected member of our population is Black with probability 0.26 and not Black with probability 1 - 0.26 = 0.74.
demographics = [0.26, 0.74]
Each time we run the following cell, we'll get a new random sample of 100 people from this population.
np.random.multinomial(100, demographics)
array([21, 79])
We also need to calculate the statistic, which in this case is the number of Black men in the random sample of 100.
np.random.multinomial(100, demographics)[0]
25
counts.counts = np.array([])
for i in np.arange(10000):
new_count = np.random.multinomial(100, demographics)[0]
counts = np.append(counts, new_count)
counts
array([29., 26., 24., ..., 27., 27., 30.])
Was a jury panel with 8 Black men suspiciously unusual?
(bpd.DataFrame().assign(count_black_men=counts)
                .plot(kind='hist', bins = np.arange(9.5, 45, 1),
                      density=True, ec='w', figsize=(10, 5),
                      title='Empiricial Distribution of the Number of Black Men in Simulated Jury Panels of Size 100'));
observed_count = 8
plt.axvline(observed_count, color='black', linewidth=4, label='Observed Number of Black Men in Actual Jury Panel')
plt.legend();
# In 10,000 random experiments, the panel with the fewest Black men had how many?
counts.min()
11.0

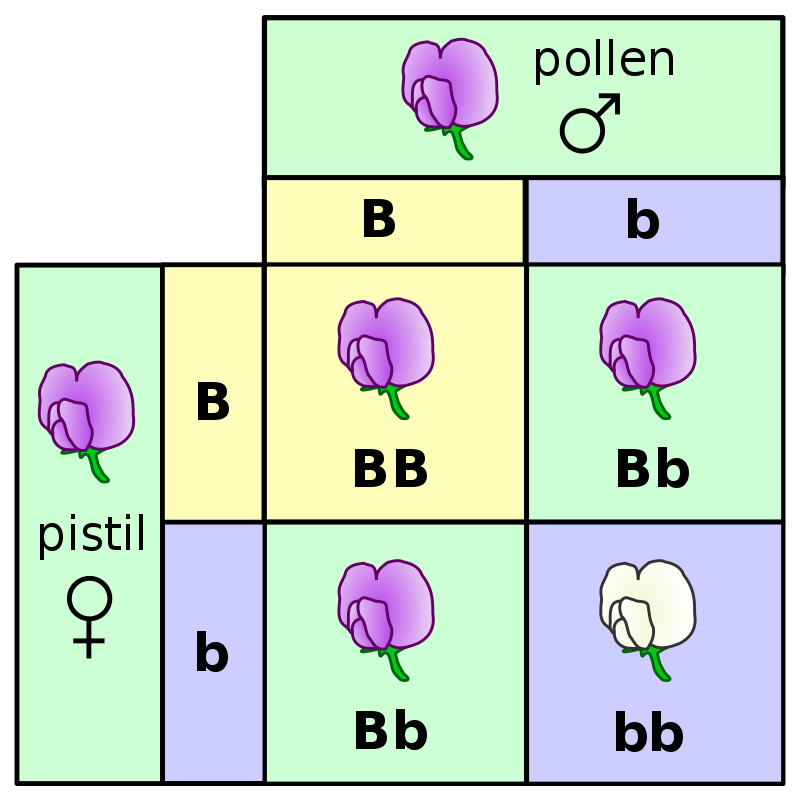
Mendel is known as the father of genetics. Many of his experiments involved pea plants.
model = [0.75, 0.25]
# Draw 929 plants and calculate the proportion of plants with purple flowers.
np.random.multinomial(929,  model)[0] / 929
0.7728740581270183
distances = np.array([])

for i in np.arange(10000):
    # Remember, model here is [0.75, 0.25].
    prop_purple = np.random.multinomial(929,  model)[0] / 929
    distance = abs(prop_purple - 0.75)
    distances = np.append(distances, distance)
bpd.DataFrame().assign(simulated_abs_differences=distances) \
               .plot(kind='hist', bins=np.arange(0, 0.055, 0.0025),
                     density=True, ec='w', figsize=(10, 5),
                     title='Empirical Distribution of the Statistic | proportion purple - 0.75 |');
Without context, these numbers aren't helpful – we need to see where the value of the statistic in Mendel's original observation lies in this distribution!
observed_distance = abs(705 / 929 - 0.75)
observed_distance
0.008880516684607098
%%capture mendel_plot

bpd.DataFrame().assign(simulated_absolute_differences=distances) \
               .plot(kind='hist', bins=np.arange(0, 0.055, 0.0025),
                     density=True, ec='w', figsize=(10, 5),
                     title='Empirical Distribution of the Statistic | proportion purple - 0.75 |');
plt.axvline(observed_distance, color='black', linewidth=4, label='Observed Value of the Statistic | proportion purple - 0.75 |')
plt.legend()
mendel_plot()
<matplotlib.legend.Legend at 0x7fe8181412b0>
Goal: Choose between two views of the world, based on data in a sample.
How do we choose between viewpoints?
Step 1: Start by assuming one of the viewpoints is true.
Step 2: Simulate many samples according to that viewpoint.
Step 3: Ask whether the observed value of the test statistic (black line) is consistent with the simulated distribution of the test statistic (red histogram).
# Our most recent example.
mendel_plot()
<matplotlib.legend.Legend at 0x7fe8181412b0>
flips_400 array below.flips_400 = bpd.read_csv('data/flips.csv').get('flips').values
flips_400
array(['Tails', 'Tails', 'Tails', ..., 'Heads', 'Heads', 'Tails'],
      dtype=object)
heads = np.count_nonzero(flips_400 == 'Heads')
heads
188
tails = len(flips_400) - heads
tails
212
Let's put these values in an array, since our simulations will also result in arrays.
flips = np.array([heads, tails])
flips
array([188, 212])
Let's consider the pair of viewpoints “This coin is fair.” OR “This coin is not fair."
def dist_from_200(arr):
    heads = arr[0]
    return abs(heads - 200)
dist_from_200(flips)
12
results array. Repeat this process many, many times.results.model = [0.5, 0.5]
repetitions = 10000
results = np.array([])
for i in np.arange(repetitions):
coins = np.random.multinomial(400, model)
result = dist_from_200(coins)
results = np.append(results, result)
results
array([11., 2., 9., ..., 2., 2., 5.])
bpd.DataFrame().assign(results=results).plot(kind='hist', bins=np.arange(0, 40, 2),
                                             density=True, ec='w', figsize=(10, 5),
                                             title='Empirical Distribution of the Statistic | Number of Heads - 200 |');
plt.axvline(dist_from_200(flips), color='black', linewidth=4, label='Observed Value of the Statistic | Number of Heads - 200 |')
plt.legend();
Let's now consider the pair of viewpoints “This coin is fair.” OR “This coin is biased towards heads.” Which test statistic would be appropriate?
def num_heads(arr):
    return arr[0]
All that will change from our previous simulation is the function we use to compute our test statistic.
model = [0.5, 0.5]

repetitions = 10000
results = np.array([])
for i in np.arange(repetitions):
    coins = np.random.multinomial(400, model)
    result = num_heads(coins)
    results = np.append(results, result)

results
array([199., 199., 193., ..., 216., 210., 198.])
bpd.DataFrame().assign(results=results).plot(kind='hist', bins=np.arange(160, 240, 4),
                                             density=True, ec='w', figsize=(10, 5),
                                             title='Empirical Distribution of the Number of Heads');
plt.axvline(num_heads(flips), color='black', linewidth=4, label='Observed Value of the Number of Heads')
plt.legend();
