From the Winter 2023 Final:
# Set up packages for lecture. Don't worry about understanding this code,
# but make sure to run it if you're following along.
import numpy as np
import babypandas as bpd
import pandas as pd
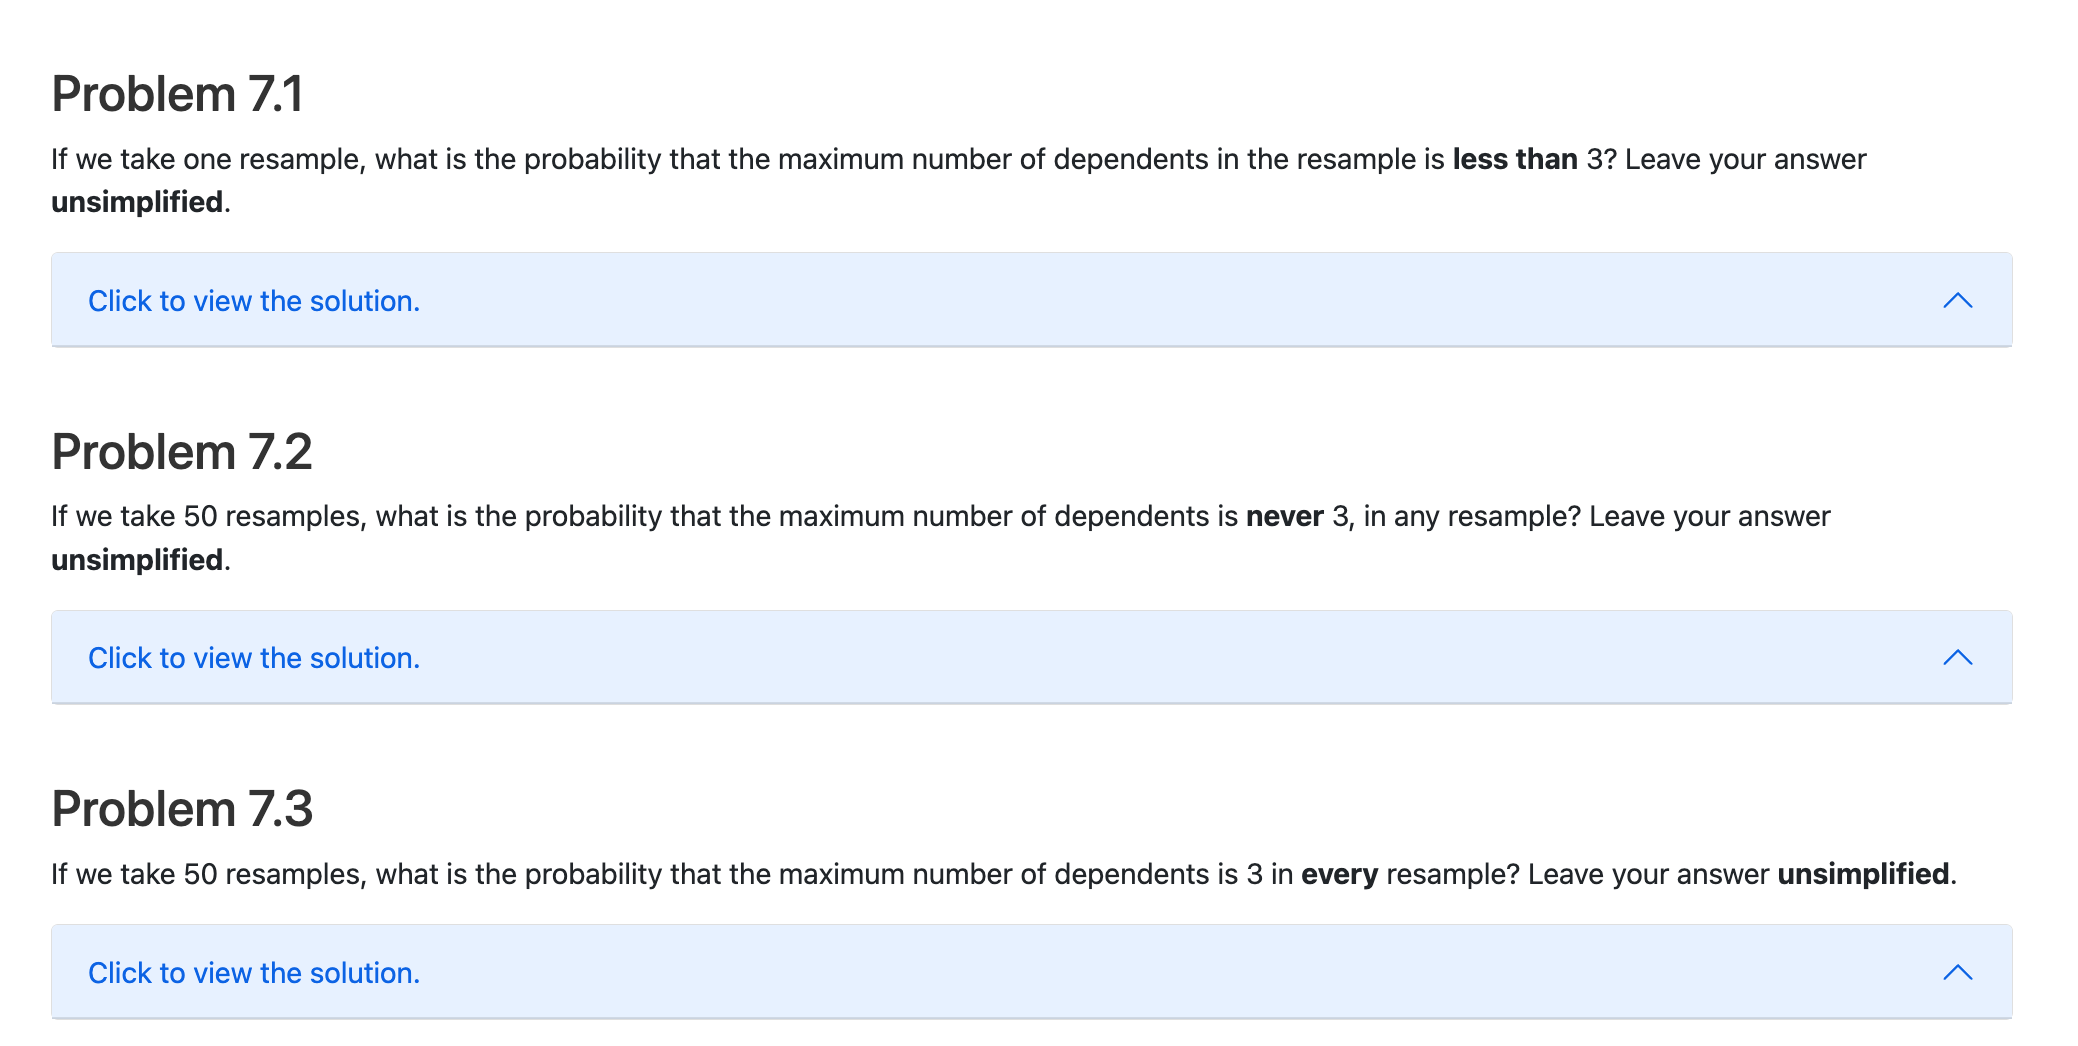
From the Winter 2023 Final:
From the Winter 2023 Final:
From the Winter 2023 Final:
From the Winter 2023 Final:
From the Fall 2022 Final:
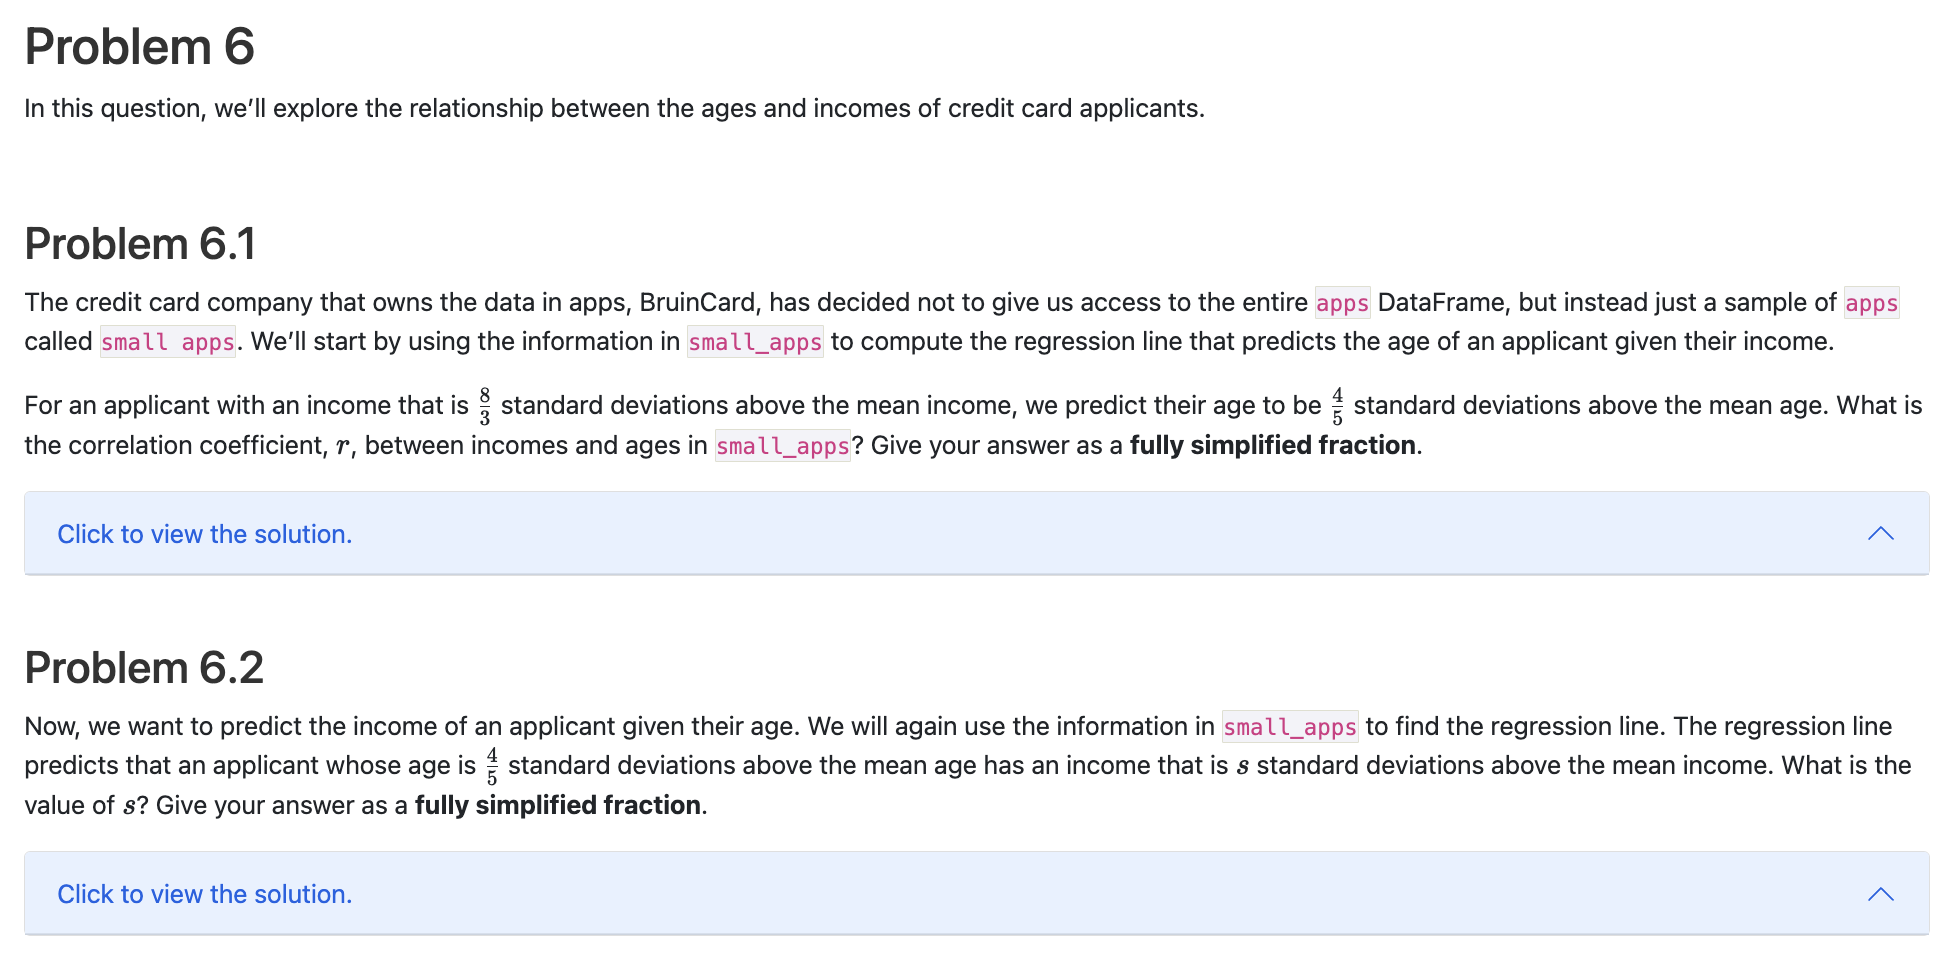
From the Fall 2022 Final:
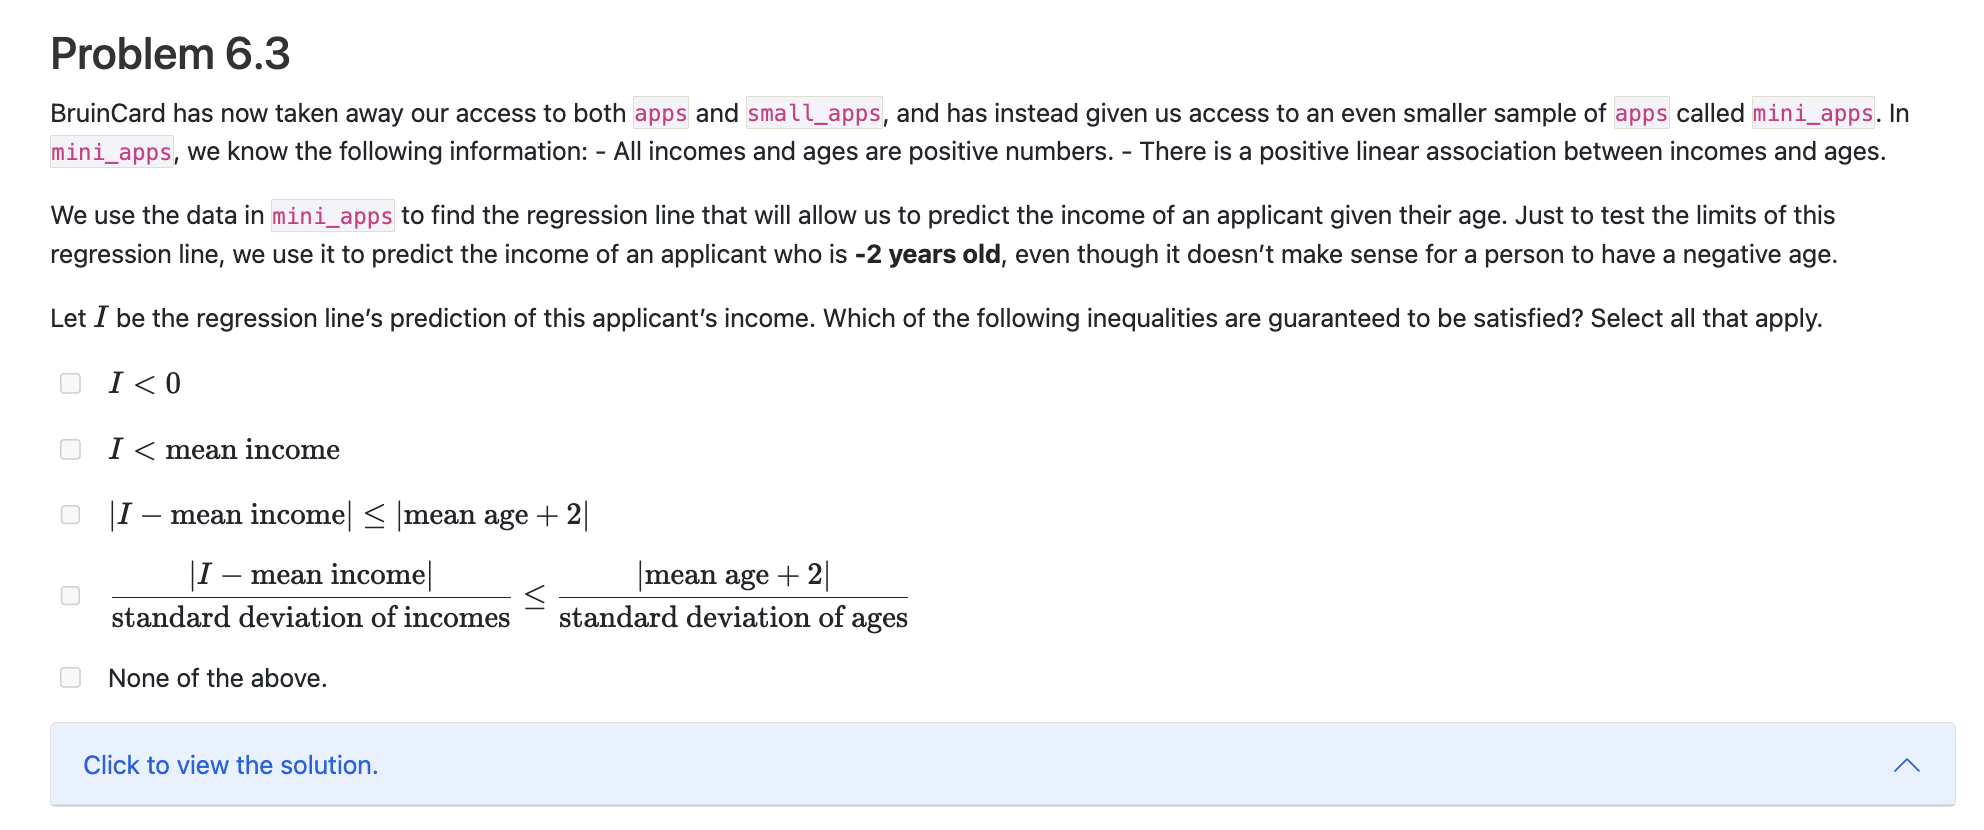
From the Fall 2022 Final:
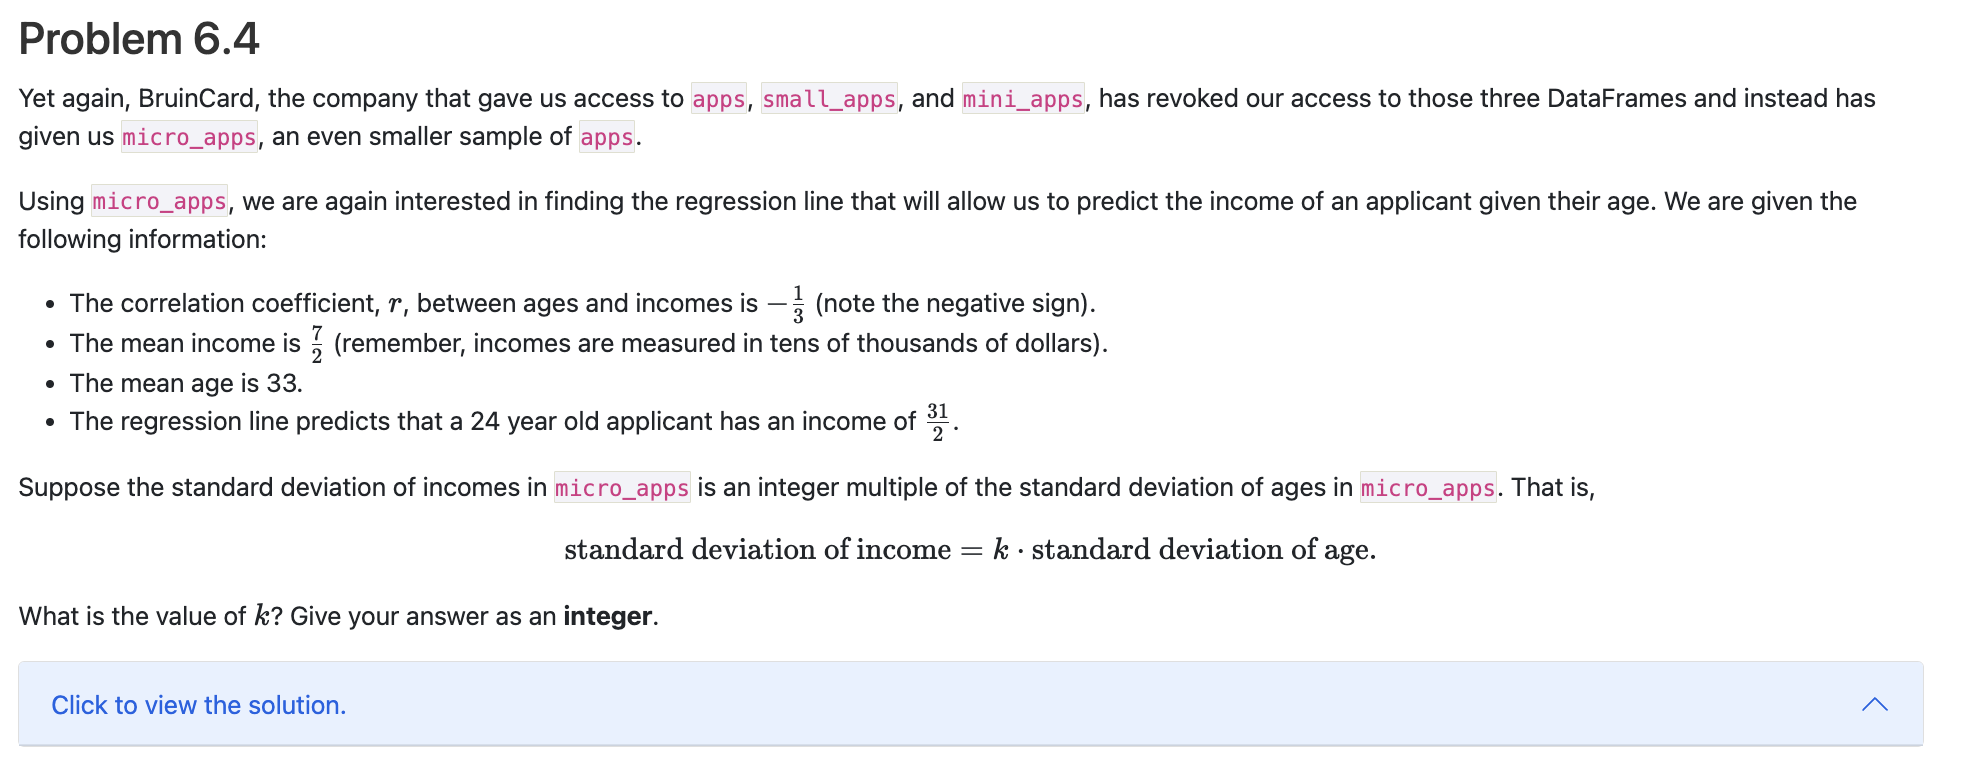
From the Fall 2022 Final:
From the Fall 2022 Final:
babypandas code is regular pandas code, too!These sites allow you to search for datasets (in CSV format) from a variety of different domains. Some may require you to sign up for an account; these are generally reputable sources.
Note that all of these links are also available at rampure.org/find-datasets.
Tip: if a site only allows you to download a file as an Excel file, not a CSV file, you can download it, open it in a spreadsheet viewer (Excel, Numbers, Google Sheets), and export it to a CSV.
The Data Science Student Society organizes project groups, which are a great way to get experience and build your resume. Keep your eye out for applications!
plotly¶matplotlib.df.plot.plotly is a different visualization library that allows us to create interactive visualizations.import plotly.express as px
Gapminder Foundation is a non-profit venture registered in Stockholm, Sweden, that promotes sustainable global development and achievement of the United Nations Millennium Development Goals by increased use and understanding of statistics and other information about social, economic and environmental development at local, national and global levels. - Gapminder Wikipedia
gapminder = px.data.gapminder()
gapminder
| country | continent | year | lifeExp | pop | gdpPercap | iso_alpha | iso_num | |
|---|---|---|---|---|---|---|---|---|
| 0 | Afghanistan | Asia | 1952 | 28.801 | 8425333 | 779.445314 | AFG | 4 |
| 1 | Afghanistan | Asia | 1957 | 30.332 | 9240934 | 820.853030 | AFG | 4 |
| 2 | Afghanistan | Asia | 1962 | 31.997 | 10267083 | 853.100710 | AFG | 4 |
| 3 | Afghanistan | Asia | 1967 | 34.020 | 11537966 | 836.197138 | AFG | 4 |
| 4 | Afghanistan | Asia | 1972 | 36.088 | 13079460 | 739.981106 | AFG | 4 |
| ... | ... | ... | ... | ... | ... | ... | ... | ... |
| 1699 | Zimbabwe | Africa | 1987 | 62.351 | 9216418 | 706.157306 | ZWE | 716 |
| 1700 | Zimbabwe | Africa | 1992 | 60.377 | 10704340 | 693.420786 | ZWE | 716 |
| 1701 | Zimbabwe | Africa | 1997 | 46.809 | 11404948 | 792.449960 | ZWE | 716 |
| 1702 | Zimbabwe | Africa | 2002 | 39.989 | 11926563 | 672.038623 | ZWE | 716 |
| 1703 | Zimbabwe | Africa | 2007 | 43.487 | 12311143 | 469.709298 | ZWE | 716 |
1704 rows × 8 columns
The dataset contains information for each country for several different years.
gapminder.get('year').unique()
array([1952, 1957, 1962, 1967, 1972, 1977, 1982, 1987, 1992, 1997, 2002,
       2007])
Let's start by just looking at 2007 data (the most recent year in the dataset).
gapminder_2007 = gapminder[gapminder.get('year') == 2007]
gapminder_2007
| country | continent | year | lifeExp | pop | gdpPercap | iso_alpha | iso_num | |
|---|---|---|---|---|---|---|---|---|
| 11 | Afghanistan | Asia | 2007 | 43.828 | 31889923 | 974.580338 | AFG | 4 |
| 23 | Albania | Europe | 2007 | 76.423 | 3600523 | 5937.029526 | ALB | 8 |
| 35 | Algeria | Africa | 2007 | 72.301 | 33333216 | 6223.367465 | DZA | 12 |
| 47 | Angola | Africa | 2007 | 42.731 | 12420476 | 4797.231267 | AGO | 24 |
| 59 | Argentina | Americas | 2007 | 75.320 | 40301927 | 12779.379640 | ARG | 32 |
| ... | ... | ... | ... | ... | ... | ... | ... | ... |
| 1655 | Vietnam | Asia | 2007 | 74.249 | 85262356 | 2441.576404 | VNM | 704 |
| 1667 | West Bank and Gaza | Asia | 2007 | 73.422 | 4018332 | 3025.349798 | PSE | 275 |
| 1679 | Yemen, Rep. | Asia | 2007 | 62.698 | 22211743 | 2280.769906 | YEM | 887 |
| 1691 | Zambia | Africa | 2007 | 42.384 | 11746035 | 1271.211593 | ZMB | 894 |
| 1703 | Zimbabwe | Africa | 2007 | 43.487 | 12311143 | 469.709298 | ZWE | 716 |
142 rows × 8 columns
We can plot life expectancy vs. GDP per capita. If you hover over a point, you will see the name of the country.
px.scatter(gapminder_2007, x='gdpPercap', y='lifeExp', hover_name='country')
In future courses, you'll learn about transformations. Here, we'll apply a log transformation to the x-axis to make the plot look a little more linear.
px.scatter(gapminder_2007, x='gdpPercap', y='lifeExp', log_x=True, hover_name='country')
We can take things one step further.
px.scatter(gapminder,
           x = 'gdpPercap',
           y = 'lifeExp',
           hover_name = 'country',
           color = 'continent',
           size = 'pop',
           size_max = 60,
           log_x = True,
           range_y = [30, 90],
           animation_frame = 'year',
           title = 'Life Expectancy, GDP Per Capita, and Population over Time'
          )
Watch this video if you want to see an even-more-animated version of this plot.
px.histogram(gapminder,
            x = 'lifeExp',
            animation_frame = 'year',
            range_x = [20, 90],
            range_y = [0, 50],
            title = 'Distribution of Life Expectancy over Time')
px.choropleth(gapminder,
              locations = 'iso_alpha',
              color = 'lifeExp',
              hover_name = 'country',
              hover_data = {'iso_alpha': False},
              title = 'Life Expectancy Per Country',
              color_continuous_scale = px.colors.sequential.tempo
)
Data science is about drawing useful conclusions from data using computation. Throughout the quarter, we touched on several aspects of data science:
Don't let your grades define you, they don't tell the full story.
This course would not have been possible without...