# Run this cell to set up packages for lecture.
from lec16_imports import *
Let's rerun our code from last time to compute a 95% confidence interval for the median salary of all San Diego city employees, based on a sample of 500 people.
Step 1: Collect a single sample of size 500 from the population.
population = bpd.read_csv('data/2022_salaries.csv').get(['TotalWages'])
population_median = population.get('TotalWages').median()
population_median # Can't see this in real life!
78136.0
np.random.seed(38) # Magic to ensure that we get the same results every time this code is run.
my_sample = population.sample(500)
sample_median = my_sample.get('TotalWages').median()
sample_median
76237.0
Step 2: Bootstrap! That is, resample from the sample a large number of times, and each time, compute the median of the resample. This will generate an empirical distribution of the sample median.
np.random.seed(38) # Magic to ensure that we get the same results every time this code is run.
# Bootstrap the sample to get more sample medians.
n_resamples = 5000
boot_medians = np.array([])
for i in np.arange(n_resamples):
resample = my_sample.sample(500, replace=True)
median = resample.get('TotalWages').median()
boot_medians = np.append(boot_medians, median)
boot_medians
array([76896. , 72945. , 73555. , ..., 74431. , 75868. , 78601.5])
Step 3: Take the middle 95% of the empirical distribution of sample medians (i.e. boot_medians
). This creates our 95% confidence interval.
left = np.percentile(boot_medians, 2.5)
right = np.percentile(boot_medians, 97.5)
# Therefore, our interval is:
[left, right]
[68469.0, 81253.5]
bpd.DataFrame().assign(BootstrapMedians=boot_medians).plot(kind='hist', density=True, bins=np.arange(63000, 88000, 1000), ec='w', figsize=(10, 5))
plt.plot([left, right], [0, 0], color='gold', linewidth=12, label='95% confidence interval');
plt.scatter(population_median, 0.000004, color='blue', s=100, label='population median').set_zorder(3)
plt.legend();
Now, instead of saying
We think the population median is close to our sample median, \$76,237.
We can say:
A 95% confidence interval for the population median is \$68,469 to \\$81,253.50.
Today, we'll address: What does 95% confidence mean? What are we confident about? Is this technique always "good"?
Video('data/ci-ring-toss.mp4', width=500)
show_confidence_interval_slides()
many_cis
below.many_cis = np.load('data/many_cis.npy')
many_cis
array([[72881.5 , 85383.32], [66727.19, 81871.47], [65449.32, 82001.4 ], ..., [64915.5 , 81814.85], [66702.5 , 79711. ], [67996.76, 82105.84]])
In the visualization below,
plt.figure(figsize=(10, 6))
for i, ci in enumerate(many_cis):
plt.plot([ci[0], ci[1]], [i, i], color='gold', linewidth=2)
plt.axvline(x=population_median, color='blue');
plt.figure(figsize=(10, 6))
count_outside = 0
for i, ci in enumerate(many_cis):
if ci[0] > population_median or ci[1] < population_median:
plt.plot([ci[0], ci[1]], [i, i], color='gold', linewidth=2)
count_outside = count_outside + 1
plt.axvline(x=population_median, color='blue');
count_outside
11
Confidence intervals can be hard to interpret.
# Our interval:
[left, right]
[68469.0, 81253.5]
Does this interval contain 95% of all salaries? No! ❌
population.plot(kind='hist', y='TotalWages', density=True, ec='w', figsize=(10, 5))
plt.plot([left, right], [0, 0], color='gold', linewidth=12, label='95% confidence interval');
plt.legend();
However, this interval does contain 95% of all bootstrapped median salaries.
bpd.DataFrame().assign(BootstrapMedians=boot_medians).plot(kind='hist', density=True, bins=np.arange(63000, 88000, 1000), ec='w', figsize=(10, 5))
plt.plot([left, right], [0, 0], color='gold', linewidth=12, label='95% confidence interval');
plt.legend();
# Our interval:
[left, right]
[68469.0, 81253.5]
Is there is a 95% chance that this interval contains the population parameter? No! ❌
Why not?
my_sample
.n_resamples = 5000
boot_maxes = np.array([])
for i in range(n_resamples):
resample = my_sample.sample(500, replace=True)
boot_max = resample.get('TotalWages').max()
boot_maxes = np.append(boot_maxes, boot_max)
boot_maxes
array([339416., 347755., 347755., ..., 257627., 339416., 339416.])
Since we have access to the population, we can find the population maximum directly, without bootstrapping.
population_max = population.get('TotalWages').max()
population_max
384909
Does the population maximum lie within the bulk of the bootstrapped distribution?
bpd.DataFrame().assign(BootstrapMax=boot_maxes).plot(kind='hist',
density=True,
bins=10,
ec='w',
figsize=(10, 5))
plt.scatter(population_max, 0.0000008, color='blue', s=100, label='population max')
plt.legend();
No, the bootstrapped distribution doesn't capture the population maximum (blue dot) of \$384,909. Why not? 🤔
my_sample.get('TotalWages').max()
347755
|
|
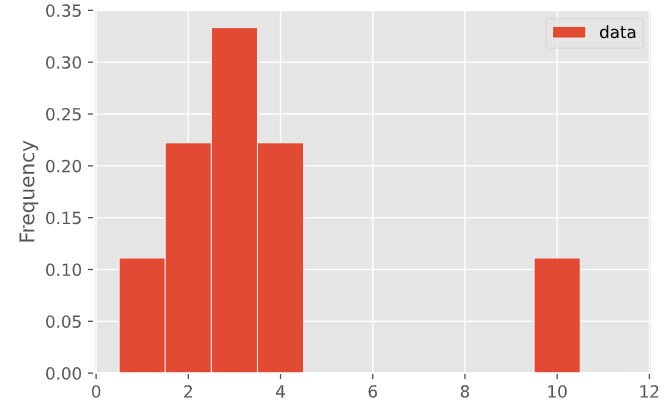
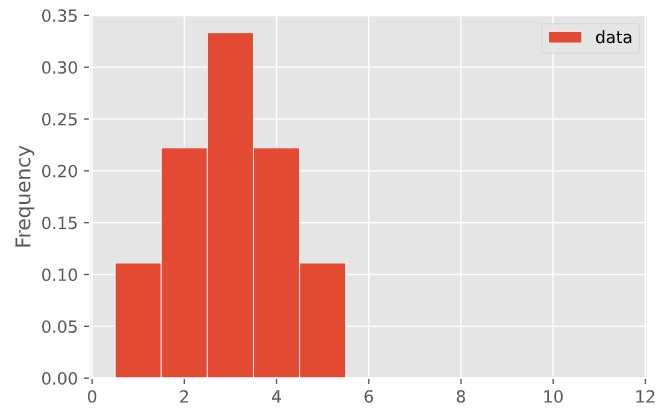
Are the means of these two distributions the same or different? What about their medians?
delays = bpd.read_csv('data/united_summer2015.csv')
delays.plot(kind='hist', y='Delay', bins=np.arange(-20.5, 210, 5), density=True, ec='w', figsize=(10, 5))
plt.title('Flight Delays')
plt.xlabel('Delay (minutes)');
Question: Which is larger – the mean or the median?
delays.get('Delay').mean()
16.658155515370705
delays.get('Delay').median()
2.0
delays.plot(kind='hist', y='Delay', bins=np.arange(-20.5, 210, 5), density=True, ec='w', alpha=0.65, figsize=(10, 5))
plt.plot([delays.get('Delay').mean(), delays.get('Delay').mean()], [0, 1], color='green', label='Mean', linewidth=2)
plt.scatter([delays.get('Delay').mean()], [-0.0017], color='green', marker='^', s=250)
plt.plot([delays.get('Delay').median(), delays.get('Delay').median()], [0, 1], color='purple', label='Median', linewidth=2)
plt.title('Flight Delays')
plt.xlabel('Delay (minutes)')
plt.ylim(-0.005, 0.065)
plt.legend();
data = np.array([2, 3, 3, 9])
np.mean(data)
4.25
deviations = data - np.mean(data)
deviations
array([-2.25, -1.25, -1.25, 4.75])
Each entry in deviations
describes how far the corresponding element in data
is from 4.25.
What is the average deviation?
np.mean(deviations)
0.0
# Square all the deviations:
deviations ** 2
array([ 5.06, 1.56, 1.56, 22.56])
variance = np.mean(deviations ** 2)
variance
7.6875
This quantity, the average squared deviation from the mean, is called the variance.
# Standard deviation (SD) is the square root of the variance.
sd = variance ** 0.5
sd
2.7726341266023544
numpy
has a function, np.std
, that calculates the standard deviation for us.# Note that this evaluates to the same number we found on the previous slide.
np.std(data)
2.7726341266023544
To summarize:
$$\begin{align*}\text{variance} &= \text{average squared deviation from the mean}\\ &= \frac{(\text{value}_1 - \text{mean})^2 + ... + (\text{value}_n - \text{mean})^2}{n}\\ \text{standard deviation} &= \sqrt{\text{variance}} \end{align*}$$where $n$ is the number of observations.
It turns out, in any numerical distribution, the bulk of the data are in the range “mean ± a few SDs”.
Let's make this more precise.
Fact: In any numerical distribution, the proportion of values in the range “mean ± $z$ SDs” is at least
$$1 - \frac{1}{z^2} $$Range | Proportion |
---|---|
mean ± 2 SDs | at least $1 - \frac{1}{4}$ (75%) |
mean ± 3 SDs | at least $1 - \frac{1}{9}$ (88.88..%) |
mean ± 4 SDs | at least $1 - \frac{1}{16}$ (93.75%) |
mean ± 5 SDs | at least $1 - \frac{1}{25}$ (96%) |
delays.plot(kind='hist', y='Delay', bins=np.arange(-20.5, 210, 5), density=True, ec='w', figsize=(10, 5), title='Flight Delays')
plt.xlabel('Delay (minutes)');
delay_mean = delays.get('Delay').mean()
delay_mean
16.658155515370705
delay_std = np.std(delays.get('Delay')) # There is no .std() method in babypandas!
delay_std
39.480199851609314
Chebyshev's inequality tells us that
delay_mean - 2 * delay_std, delay_mean + 2 * delay_std
(-62.30224418784792, 95.61855521858934)
delay_mean - 3 * delay_std, delay_mean + 3 * delay_std
(-101.78244403945723, 135.09875507019865)
Let's visualize these intervals!
delays.plot(kind='hist', y='Delay', bins=np.arange(-20.5, 210, 5), density=True, alpha=0.65, ec='w', figsize=(10, 5), title='Flight Delays')
plt.axvline(delay_mean - 2 * delay_std, color='maroon', label='± 2 SD')
plt.axvline(delay_mean + 2 * delay_std, color='maroon')
plt.axvline(delay_mean + 3 * delay_std, color='blue', label='± 3 SD')
plt.axvline(delay_mean - 3 * delay_std, color='blue')
plt.axvline(delay_mean, color='green', label='Mean')
plt.scatter([delay_mean], [-0.0017], color='green', marker='^', s=250)
plt.ylim(-0.0038, 0.06)
plt.legend();
Remember, Chebyshev's inequality states that at least $1 - \frac{1}{z^2}$ of values are within $z$ SDs from the mean, for any numerical distribution.
For instance, it tells us that at least 75% of delays are in the following interval:
delay_mean - 2 * delay_std, delay_mean + 2 * delay_std
(-62.30224418784792, 95.61855521858934)
However, in this case, a much larger fraction of delays are in that interval.
within_2_sds = delays[(delays.get('Delay') >= delay_mean - 2 * delay_std) &
(delays.get('Delay') <= delay_mean + 2 * delay_std)]
within_2_sds.shape[0] / delays.shape[0]
0.9560940325497288
If we know more about the shape of the distribution, we can provide better guarantees for the proportion of values within $z$ SDs of the mean.
For a particular set of data points, Chebyshev's inequality states that at least $\frac{8}{9}$ of the data points are between $-20$ and $40$. What is the standard deviation of the data?
What is the "normal" distribution, and how does it relate to some of the distributions we've already seen?