
import pandas as pd
import numpy as np
import os

import matplotlib.pyplot as plt
# plt.rcParams['figure.figsize'] = (10, 5)
plt.style.use('seaborn-white')   # seaborn custom plot style
plt.rc('figure', dpi=100, figsize=(10, 5))   # set default size/resolution
plt.rc('font', size=12)   # font size
In other words, how well does the data represent reality?
Does the data contain unrealistic or "incorrect" values?
The dataset we're working with contains all of the vehicle stops that the San Diego Police Department made in 2016.
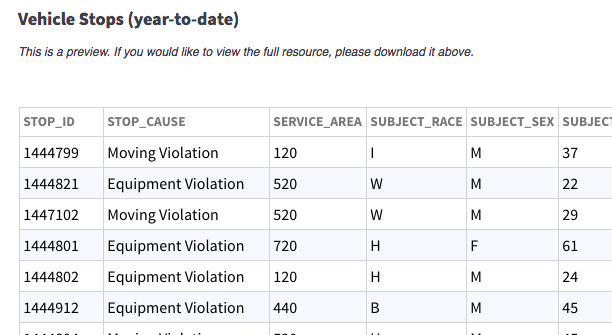
stops = pd.read_csv('data/vehicle_stops_2016_datasd.csv')
stops.head()
| stop_id | stop_cause | service_area | subject_race | subject_sex | subject_age | timestamp | stop_date | stop_time | sd_resident | arrested | searched | obtained_consent | contraband_found | property_seized | |
|---|---|---|---|---|---|---|---|---|---|---|---|---|---|---|---|
| 0 | 1308198 | Equipment Violation | 530 | W | M | 28 | 2016-01-01 00:06:00 | 2016-01-01 | 0:06 | Y | N | N | N | N | N |
| 1 | 1308172 | Moving Violation | 520 | B | M | 25 | 2016-01-01 00:10:00 | 2016-01-01 | 0:10 | N | N | N | NaN | NaN | NaN |
| 2 | 1308171 | Moving Violation | 110 | H | F | 31 | 2016-01-01 00:14:00 | 2016-01-01 | 0:14 | NaN | NaN | NaN | NaN | NaN | NaN |
| 3 | 1308170 | Moving Violation | Unknown | W | F | 29 | 2016-01-01 00:16:00 | 2016-01-01 | 0:16 | N | N | N | NaN | NaN | NaN |
| 4 | 1308197 | Moving Violation | 230 | W | M | 52 | 2016-01-01 00:30:00 | 2016-01-01 | 0:30 | N | N | N | NaN | NaN | NaN |
stops.head(1)
| stop_id | stop_cause | service_area | subject_race | subject_sex | subject_age | timestamp | stop_date | stop_time | sd_resident | arrested | searched | obtained_consent | contraband_found | property_seized | |
|---|---|---|---|---|---|---|---|---|---|---|---|---|---|---|---|
| 0 | 1308198 | Equipment Violation | 530 | W | M | 28 | 2016-01-01 00:06:00 | 2016-01-01 | 0:06 | Y | N | N | N | N | N |
stops.info()
<class 'pandas.core.frame.DataFrame'>
RangeIndex: 103051 entries, 0 to 103050
Data columns (total 15 columns):
 #   Column            Non-Null Count   Dtype
---  ------            --------------   -----
 0   stop_id           103051 non-null  int64
 1   stop_cause        103044 non-null  object
 2   service_area      103051 non-null  object
 3   subject_race      102920 non-null  object
 4   subject_sex       102865 non-null  object
 5   subject_age       100284 non-null  object
 6   timestamp         102879 non-null  object
 7   stop_date         103051 non-null  object
 8   stop_time         103051 non-null  object
 9   sd_resident       83689 non-null   object
 10  arrested          84400 non-null   object
 11  searched          83330 non-null   object
 12  obtained_consent  4791 non-null    object
 13  contraband_found  4969 non-null    object
 14  property_seized   4924 non-null    object
dtypes: int64(1), object(14)
memory usage: 11.8+ MB
'subject_age' – some are too high to be true, some are too low to be true.stops['subject_age'].unique()
array(['28', '25', '31', '29', '52', '24', '20', '50', '23', '54', '53',
       '35', '38', '18', '48', '68', '45', '63', '49', '42', '27', '19',
       '55', '32', '47', '33', '41', '59', '60', '58', '26', '36', '40',
       '39', '21', '64', '30', '43', '17', '51', '34', '56', '44', '22',
       '69', '46', '16', '57', '37', '65', '72', '67', '66', '70', '62',
       '73', '74', '0', '77', nan, '89', '79', '61', '78', '99', '75',
       '85', '82', '71', '15', '80', '81', '93', '84', '76', '2', '4',
       '86', '91', '83', '88', '98', '87', 'No Age', '9', '100', '14',
       '95', '96', '92', '119', '1', '90', '163', '5', '114', '94', '10',
       '212', '220', '6', '145', '97', '120'], dtype=object)
ages = pd.to_numeric(stops['subject_age'], errors='coerce')
ages.describe()
count    99648.000000
mean        37.277697
std         14.456934
min          0.000000
25%         25.000000
50%         34.000000
75%         47.000000
max        220.000000
Name: subject_age, dtype: float64
Ages range all over the place, from 0 to 220. Was a 220 year old really pulled over?
stops.loc[ages > 100]
| stop_id | stop_cause | service_area | subject_race | subject_sex | subject_age | timestamp | stop_date | stop_time | sd_resident | arrested | searched | obtained_consent | contraband_found | property_seized | |
|---|---|---|---|---|---|---|---|---|---|---|---|---|---|---|---|
| 25029 | 1333254 | Equipment Violation | 820 | W | F | 119 | 2016-03-19 22:20:00 | 2016-03-19 | 22:20 | N | N | N | NaN | NaN | NaN |
| 34179 | 1375483 | Moving Violation | 510 | W | M | 163 | 2016-04-18 16:35:00 | 2016-04-18 | 16:35 | N | N | N | NaN | NaN | NaN |
| 36968 | 1378369 | Moving Violation | 240 | A | F | 114 | 2016-04-28 11:44:00 | 2016-04-28 | 11:44 | NaN | NaN | NaN | NaN | NaN | NaN |
| 63570 | 1405478 | Moving Violation | 110 | V | M | 212 | 2016-08-04 18:10:00 | 2016-08-04 | 18:10 | Y | N | N | NaN | NaN | NaN |
| 70267 | 1411694 | Moving Violation | 310 | H | F | 220 | 2016-08-30 18:28:00 | 2016-08-30 | 18:28 | Y | N | N | NaN | NaN | NaN |
| 77038 | 1418885 | Moving Violation | 830 | B | M | 145 | 2016-09-22 20:35:00 | 2016-09-22 | 20:35 | Y | N | Y | N | N | NaN |
| 99449 | 1440889 | Equipment Violation | 120 | W | F | 120 | 2016-12-15 19:28:00 | 2016-12-15 | 19:28 | Y | N | N | NaN | NaN | NaN |
ages.loc[(ages >= 0) & (ages < 16)].value_counts()
0.0     218
15.0     27
2.0       6
14.0      5
4.0       4
1.0       2
10.0      2
9.0       1
5.0       1
6.0       1
Name: subject_age, dtype: int64
stops.loc[(ages >= 0) & (ages < 16)]
| stop_id | stop_cause | service_area | subject_race | subject_sex | subject_age | timestamp | stop_date | stop_time | sd_resident | arrested | searched | obtained_consent | contraband_found | property_seized | |
|---|---|---|---|---|---|---|---|---|---|---|---|---|---|---|---|
| 547 | 1308628 | Moving Violation | 120 | W | M | 0 | 2016-01-03 16:20:00 | 2016-01-03 | 16:20 | NaN | NaN | NaN | NaN | NaN | NaN |
| 747 | 1308820 | Moving Violation | Unknown | H | F | 0 | 2016-01-04 22:13:00 | 2016-01-04 | 22:13 | N | N | N | NaN | NaN | NaN |
| 1686 | 1309896 | Moving Violation | 120 | W | M | 15 | 2016-01-08 19:30:00 | 2016-01-08 | 19:30 | N | N | N | NaN | NaN | NaN |
| 1752 | 1309975 | Moving Violation | Unknown | O | M | 0 | 2016-01-08 23:20:00 | 2016-01-08 | 23:20 | N | N | N | NaN | NaN | NaN |
| 2054 | 1310377 | Equipment Violation | 430 | H | F | 0 | 2016-01-10 16:42:00 | 2016-01-10 | 16:42 | Y | N | N | NaN | NaN | NaN |
| ... | ... | ... | ... | ... | ... | ... | ... | ... | ... | ... | ... | ... | ... | ... | ... |
| 100465 | 1442806 | Moving Violation | 810 | O | M | 15 | 2016-12-20 10:45:00 | 2016-12-20 | 10:45 | Y | N | N | NaN | NaN | NaN |
| 101495 | 1443500 | Moving Violation | 320 | W | M | 0 | 2016-12-23 22:30:00 | 2016-12-23 | 22:30 | NaN | NaN | NaN | NaN | NaN | NaN |
| 101784 | 1443745 | Moving Violation | Unknown | O | M | 0 | 2016-12-26 19:30:00 | 2016-12-26 | 19:30 | NaN | NaN | NaN | NaN | NaN | NaN |
| 101790 | 1443747 | Moving Violation | 320 | W | F | 0 | 2016-12-26 20:00:00 | 2016-12-26 | 20:00 | NaN | NaN | NaN | NaN | NaN | NaN |
| 102848 | 1444647 | Moving Violation | 320 | W | M | 0 | 2016-12-31 17:45:00 | 2016-12-31 | 17:45 | NaN | NaN | NaN | NaN | NaN | NaN |
267 rows × 15 columns
'subject_age'¶'No Age' and 0 are likely explicit null values.Let's look at all unique stop causes. Notice that there are three different causes related to bicycles, which should probably all fall under the same cause.
stops['stop_cause'].value_counts()
Moving Violation                      75200
Equipment Violation                   26234
Radio Call/Citizen Contact              571
Muni, County, H&S Code                  319
Personal Knowledge/Informant            289
No Cause Specified on a Card            184
Suspect Info (I.S., Bulletin, Log)      181
Personal Observ/Knowledge                45
MUNI, County, H&S Code                   14
Bicycle                                   2
Suspect Info                              2
BICYCLE                                   1
B & P                                     1
Bicycle Bicycle                           1
Name: stop_cause, dtype: int64
Let's plot the distribution of ages, within a reasonable range (15 to 85). What do you notice?
# DSC 10 review: what does density=True do?
ages.loc[(ages > 15) & (ages <= 85)].plot(kind='hist', density=True, bins=70, ec='w');

Now let's look at the first few and last few rows of stops.
stops[['timestamp', 'stop_date', 'stop_time']].head()
| timestamp | stop_date | stop_time | |
|---|---|---|---|
| 0 | 2016-01-01 00:06:00 | 2016-01-01 | 0:06 |
| 1 | 2016-01-01 00:10:00 | 2016-01-01 | 0:10 |
| 2 | 2016-01-01 00:14:00 | 2016-01-01 | 0:14 |
| 3 | 2016-01-01 00:16:00 | 2016-01-01 | 0:16 |
| 4 | 2016-01-01 00:30:00 | 2016-01-01 | 0:30 |
stops[['timestamp', 'stop_date', 'stop_time']].tail(10)
| timestamp | stop_date | stop_time | |
|---|---|---|---|
| 103041 | NaN | 2016-12-13 | 0.398611111 |
| 103042 | NaN | 2016-12-15 | 0.383333333 |
| 103043 | NaN | 2016-12-15 | 0.397916667 |
| 103044 | NaN | 2016-12-19 | 0:91 |
| 103045 | NaN | 2016-12-20 | 0:82 |
| 103046 | NaN | 2016-12-20 | 0.397916667 |
| 103047 | NaN | 2016-12-21 | 0:73 |
| 103048 | NaN | 2016-12-21 | 0:94 |
| 103049 | NaN | 2016-12-29 | 0:81 |
| 103050 | NaN | 2016-12-29 | -0:81 |
Do you think '-0:81' is a time that a computer would record?
Consistently "incorrect" values.
Abnormal artifacts from the data collection process.
Unreasonable outliers.
You'll use the following methods regularly when initially exploring a dataset.
.describe(): see basic numerical information about a Series/DataFrame..info(): see data types and the number of missing values in a Series/DataFrame..value_counts(): see the distribution of a categorical variable..plot(kind='hist'): plot the distribution of a numerical variable.Another term for "missing" is "null".
Missing values are most often encoded with NULL, None, NaN, '', etc.
0 (e.g. 0, '0', 'zero') are common substitutes for null.
What are the non-np.NaN null values in the stops dataset?
'Unknown'.0, 'No Age'.stops
| stop_id | stop_cause | service_area | subject_race | subject_sex | subject_age | timestamp | stop_date | stop_time | sd_resident | arrested | searched | obtained_consent | contraband_found | property_seized | |
|---|---|---|---|---|---|---|---|---|---|---|---|---|---|---|---|
| 0 | 1308198 | Equipment Violation | 530 | W | M | 28 | 2016-01-01 00:06:00 | 2016-01-01 | 0:06 | Y | N | N | N | N | N |
| 1 | 1308172 | Moving Violation | 520 | B | M | 25 | 2016-01-01 00:10:00 | 2016-01-01 | 0:10 | N | N | N | NaN | NaN | NaN |
| 2 | 1308171 | Moving Violation | 110 | H | F | 31 | 2016-01-01 00:14:00 | 2016-01-01 | 0:14 | NaN | NaN | NaN | NaN | NaN | NaN |
| 3 | 1308170 | Moving Violation | Unknown | W | F | 29 | 2016-01-01 00:16:00 | 2016-01-01 | 0:16 | N | N | N | NaN | NaN | NaN |
| 4 | 1308197 | Moving Violation | 230 | W | M | 52 | 2016-01-01 00:30:00 | 2016-01-01 | 0:30 | N | N | N | NaN | NaN | NaN |
| ... | ... | ... | ... | ... | ... | ... | ... | ... | ... | ... | ... | ... | ... | ... | ... |
| 103046 | 1443046 | Moving Violation | 110 | H | M | 40 | NaN | 2016-12-20 | 0.397916667 | Y | N | N | NaN | NaN | NaN |
| 103047 | 1443132 | Moving Violation | 310 | W | M | No Age | NaN | 2016-12-21 | 0:73 | N | N | N | NaN | NaN | NaN |
| 103048 | 1443169 | Moving Violation | Unknown | H | M | 26 | NaN | 2016-12-21 | 0:94 | Y | N | N | NaN | NaN | NaN |
| 103049 | 1447090 | Moving Violation | 430 | F | F | 63 | NaN | 2016-12-29 | 0:81 | N | N | N | NaN | NaN | NaN |
| 103050 | 1445548 | Moving Violation | 320 | O | F | 34 | NaN | 2016-12-29 | -0:81 | Y | N | N | NaN | NaN | NaN |
103051 rows × 15 columns
pandas¶NaN value, which is of type float.isna method for DataFrame/Series detects missing values.isnull is equivalent to isna.type(np.NaN)
float
# All of the rows where the subject age is missing
stops[stops['subject_age'].isna()]
| stop_id | stop_cause | service_area | subject_race | subject_sex | subject_age | timestamp | stop_date | stop_time | sd_resident | arrested | searched | obtained_consent | contraband_found | property_seized | |
|---|---|---|---|---|---|---|---|---|---|---|---|---|---|---|---|
| 606 | 1309398 | Moving Violation | Unknown | H | M | NaN | 2016-01-04 00:01:00 | 2016-01-04 | 0:01 | N | N | N | NaN | NaN | NaN |
| 607 | 1309404 | Moving Violation | 510 | W | M | NaN | 2016-01-04 00:01:00 | 2016-01-04 | 0:01 | Y | N | N | NaN | NaN | NaN |
| 653 | 1309400 | Moving Violation | 620 | W | F | NaN | 2016-01-04 13:00:00 | 2016-01-04 | 13:00 | Y | N | N | NaN | NaN | NaN |
| 658 | 1309399 | Moving Violation | 620 | W | F | NaN | 2016-01-04 13:55:00 | 2016-01-04 | 13:55 | Y | N | N | NaN | NaN | NaN |
| 816 | 1309424 | Moving Violation | 620 | W | F | NaN | 2016-01-05 08:30:00 | 2016-01-05 | 8:30 | N | N | N | NaN | NaN | NaN |
| ... | ... | ... | ... | ... | ... | ... | ... | ... | ... | ... | ... | ... | ... | ... | ... |
| 102989 | 1412614 | Moving Violation | 120 | W | F | NaN | NaN | 2016-08-30 | 24:40:00 | Y | N | N | NaN | NaN | NaN |
| 102990 | 1414071 | Moving Violation | 110 | W | M | NaN | NaN | 2016-08-31 | 0:91 | N | N | N | NaN | NaN | NaN |
| 102991 | 1414020 | Moving Violation | 930 | O | F | NaN | NaN | 2016-08-31 | 98:35:00 | Y | N | N | NaN | NaN | NaN |
| 103002 | 1420099 | Moving Violation | 610 | H | M | NaN | NaN | 2016-09-27 | 0.565972222 | N | N | N | NaN | NaN | NaN |
| 103005 | 1422234 | Moving Violation | 620 | W | M | NaN | NaN | 2016-10-05 | 0.417361111 | N | N | N | NaN | NaN | NaN |
2767 rows × 15 columns
# Proportion of values missing in the subject_age column
stops['subject_age'].isna().mean()
0.026850782622196777
# Proportion of missing values in all columns
stops.isna().mean()
stop_id             0.000000
stop_cause          0.000068
service_area        0.000000
subject_race        0.001271
subject_sex         0.001805
subject_age         0.026851
timestamp           0.001669
stop_date           0.000000
stop_time           0.000000
sd_resident         0.187888
arrested            0.180988
searched            0.191371
obtained_consent    0.953508
contraband_found    0.951781
property_seized     0.952218
dtype: float64
dropna method:stops.head()
| stop_id | stop_cause | service_area | subject_race | subject_sex | subject_age | timestamp | stop_date | stop_time | sd_resident | arrested | searched | obtained_consent | contraband_found | property_seized | |
|---|---|---|---|---|---|---|---|---|---|---|---|---|---|---|---|
| 0 | 1308198 | Equipment Violation | 530 | W | M | 28 | 2016-01-01 00:06:00 | 2016-01-01 | 0:06 | Y | N | N | N | N | N |
| 1 | 1308172 | Moving Violation | 520 | B | M | 25 | 2016-01-01 00:10:00 | 2016-01-01 | 0:10 | N | N | N | NaN | NaN | NaN |
| 2 | 1308171 | Moving Violation | 110 | H | F | 31 | 2016-01-01 00:14:00 | 2016-01-01 | 0:14 | NaN | NaN | NaN | NaN | NaN | NaN |
| 3 | 1308170 | Moving Violation | Unknown | W | F | 29 | 2016-01-01 00:16:00 | 2016-01-01 | 0:16 | N | N | N | NaN | NaN | NaN |
| 4 | 1308197 | Moving Violation | 230 | W | M | 52 | 2016-01-01 00:30:00 | 2016-01-01 | 0:30 | N | N | N | NaN | NaN | NaN |
stops.dropna().head()
| stop_id | stop_cause | service_area | subject_race | subject_sex | subject_age | timestamp | stop_date | stop_time | sd_resident | arrested | searched | obtained_consent | contraband_found | property_seized | |
|---|---|---|---|---|---|---|---|---|---|---|---|---|---|---|---|
| 0 | 1308198 | Equipment Violation | 530 | W | M | 28 | 2016-01-01 00:06:00 | 2016-01-01 | 0:06 | Y | N | N | N | N | N |
| 8 | 1308979 | Moving Violation | 310 | H | F | 25 | 2016-01-01 01:03:00 | 2016-01-01 | 1:03 | Y | N | Y | N | N | N |
| 20 | 1308187 | Equipment Violation | 510 | H | M | 31 | 2016-01-01 08:15:00 | 2016-01-01 | 8:15 | Y | N | Y | N | Y | Y |
| 21 | 1308186 | Moving Violation | 710 | H | F | 48 | 2016-01-01 08:21:00 | 2016-01-01 | 8:21 | N | N | N | N | N | N |
| 39 | 1308193 | Moving Violation | 710 | H | F | 32 | 2016-01-01 11:09:00 | 2016-01-01 | 11:09 | N | N | N | N | N | N |
stops.shape
(103051, 15)
stops.dropna().shape
(4619, 15)
When used on a DataFrame:
.dropna() drops rows containing at least one null value..dropna(how='all') drops rows containing only null values..dropna(axis=1) drops columns containing at least one null value.thresh, subset.nans = pd.DataFrame([[0, 1, np.NaN], [np.NaN, np.NaN, np.NaN], [1, 2, 3]], columns='A B C'.split())
nans
| A | B | C | |
|---|---|---|---|
| 0 | 0.0 | 1.0 | NaN |
| 1 | NaN | NaN | NaN |
| 2 | 1.0 | 2.0 | 3.0 |
nans.dropna(how='any')
| A | B | C | |
|---|---|---|---|
| 2 | 1.0 | 2.0 | 3.0 |
nans.dropna(how='all')
| A | B | C | |
|---|---|---|---|
| 0 | 0.0 | 1.0 | NaN |
| 2 | 1.0 | 2.0 | 3.0 |
nans.dropna(axis=1)
| 0 |
|---|
| 1 |
| 2 |
nans.dropna(subset=['A', 'B'])
| A | B | C | |
|---|---|---|---|
| 0 | 0.0 | 1.0 | NaN |
| 2 | 1.0 | 2.0 | 3.0 |
The fillna method replaces all null values. Specifically:
.fillna(val) fills null entries with the value val..fillna(dict) fills null entries using a dictionary dict of column/row values..fillna(method='bfill') and .fillna(method='ffill') fill null entries using neighboring non-null entries.nans
| A | B | C | |
|---|---|---|---|
| 0 | 0.0 | 1.0 | NaN |
| 1 | NaN | NaN | NaN |
| 2 | 1.0 | 2.0 | 3.0 |
# Filling all NaNs with the same value
nans.fillna('billy')
| A | B | C | |
|---|---|---|---|
| 0 | 0.0 | 1.0 | billy |
| 1 | billy | billy | billy |
| 2 | 1.0 | 2.0 | 3.0 |
# Filling NaNs differently for each column
nans.fillna({'A': 'f0', 'B': 'f1', 'C': 'f2'})
| A | B | C | |
|---|---|---|---|
| 0 | 0.0 | 1.0 | f2 |
| 1 | f0 | f1 | f2 |
| 2 | 1.0 | 2.0 | 3.0 |
# Dictionary of column means
# Note that most numerical methods ignore null values
means = {c: nans[c].mean() for c in nans.columns}
means
{'A': 0.5, 'B': 1.5, 'C': 3.0}
# Filling NaNs with column means
nans.fillna(means)
| A | B | C | |
|---|---|---|---|
| 0 | 0.0 | 1.0 | 3.0 |
| 1 | 0.5 | 1.5 | 3.0 |
| 2 | 1.0 | 2.0 | 3.0 |
# Another way of doing the same thing
nans.apply(lambda x: x.fillna(x.mean()), axis=0)
| A | B | C | |
|---|---|---|---|
| 0 | 0.0 | 1.0 | 3.0 |
| 1 | 0.5 | 1.5 | 3.0 |
| 2 | 1.0 | 2.0 | 3.0 |
nans
| A | B | C | |
|---|---|---|---|
| 0 | 0.0 | 1.0 | NaN |
| 1 | NaN | NaN | NaN |
| 2 | 1.0 | 2.0 | 3.0 |
# bfill stands for "backfill"
nans.fillna(method='bfill')
| A | B | C | |
|---|---|---|---|
| 0 | 0.0 | 1.0 | 3.0 |
| 1 | 1.0 | 2.0 | 3.0 |
| 2 | 1.0 | 2.0 | 3.0 |
# ffill stands for "forward fill"
nans.fillna(method='ffill')
| A | B | C | |
|---|---|---|---|
| 0 | 0.0 | 1.0 | NaN |
| 1 | 0.0 | 1.0 | NaN |
| 2 | 1.0 | 2.0 | 3.0 |
np.NaN¶==, !=, <, >) with np.NaN is False.pd.isna, which returns whether the argument is np.NaN or None.pd.isnull.NaN is of type float – watch out for type coercion!nans
| A | B | C | |
|---|---|---|---|
| 0 | 0.0 | 1.0 | NaN |
| 1 | NaN | NaN | NaN |
| 2 | 1.0 | 2.0 | 3.0 |
np.NaN == np.NaN
False
pd.isna(np.NaN)
True
nans.isna()
| A | B | C | |
|---|---|---|---|
| 0 | False | False | True |
| 1 | True | True | True |
| 2 | False | False | False |
nans.isnull()
| A | B | C | |
|---|---|---|---|
| 0 | False | False | True |
| 1 | True | True | True |
| 2 | False | False | False |
# Since np.NaN is a float, the Series is of type float despite the two ints
pd.Series([0, 1, np.NaN])
0    0.0
1    1.0
2    NaN
dtype: float64
Now our data is clean and we're confident that it's faithful to the data generating process.
How do we ask questions and draw conclusions about the data generating process, using our observed data?
Run the following cell to set things up.
np.random.seed(42)

flips = pd.DataFrame(np.random.choice(['H', 'T'], p=[0.55, 0.45], size=(114,1)), columns=['result'])
flips.head()
| result | |
|---|---|
| 0 | H |
| 1 | T |
| 2 | T |
| 3 | T |
| 4 | H |
flips.value_counts()
result
H         68
T         46
dtype: int64
# The to_frame method converts a Series to a DataFrame
flips['result'].value_counts().to_frame()
| result | |
|---|---|
| H | 68 |
| T | 46 |
# Normalized
flips['result'].value_counts(normalize=True).to_frame()
| result | |
|---|---|
| H | 0.596491 |
| T | 0.403509 |
A test statistic is a number that we compute in each repetition of an experiment, to help us make a decision.
Suppose a coin was flipped $N$ times, and $N_H$ flips were heads. Then, each of the following is a test statistic we could choose:
The former three would be helpful for the alternative hypothesis "the coin was biased in favor of heads" (or tails).
Let's use the number of heads ($N_H$) as our test statistic. We need to:
# This DataFrame contains our "observed data"
flips.head()
| result | |
|---|---|
| 0 | H |
| 1 | T |
| 2 | T |
| 3 | T |
| 4 | H |
# Number of coin flips
flips.shape
(114, 1)
# Observed statistic
obs = (flips['result'] == 'H').sum()
obs
68
# Number of simulations
N = 10000

# 10000 times, we want to flip a coin 114 times
results = []
for _ in range(N):
    simulation = np.random.choice(['H', 'T'], p=[0.5, 0.5], size=114)
    sim_heads = (simulation == 'H').sum()  # Test statistic
    results.append(sim_heads)
Each entry in results is the number of heads in 114 simulated coin flips.
results[:10]
[55, 50, 55, 48, 70, 53, 65, 55, 57, 48]
pd.Series(results).plot(kind='hist',
                        density=True,
                        bins=np.arange(35, 76, 1),
                        ec='w',
                        title='Number of Heads in 114 Flips of a Fair Coin');
plt.axvline(x=obs, color='red', linewidth=4);

Question: Do you think the coin was fair?
(np.array(results) >= obs).mean()
0.0244
fillna, isna/isnull, dropna.