import pandas as pd
import numpy as np
import seaborn as sns
| Name | Assignment | Score |
|---|---|---|
| Billy | Homework 1 | 94 |
| Sally | Homework 1 | 98 |
| Molly | Homework 1 | 82 |
| Sally | Homework 2 | 47 |
| Student Name | Quarter | Course | Instructor | Recommend? | Expected Grade | Hours Per Week | Comments |
|---|---|---|---|---|---|---|---|
| Billy | SP22 | DSC 80 | Suraj Rampure | No | A- | 14 | I hate this class |
| Billy | SP22 | DSC 40B | Arya Mazumdar | Yes | B+ | 9 | go big O |
| Sally | SP22 | DSC 10 | Janine Tiefenbruck | Yes | A | 11 | babypandas are so cute |
| Molly | SP22 | DSC 80 | Suraj Rampure | Yes | A+ | 2 | I wish there was music in class |
Only instructors can see individual responses. At cape.ucsd.edu, only overall class statistics are visible.
| Quarter | Course | Instructor | Recommend (%) | Expected Grade | Hours Per Week |
|---|---|---|---|---|---|
| SP22 | DSC 80 | Suraj Rampure | 23% | 3.15 (B) | 13.32 |
| SP22 | DSC 40B | Arya Mazumdar | 89% | 3.35 (B+) | 8.54 |
| SP22 | DSC 10 | Janine Tiefenbruck | 94% | 3.45 (B+) | 11.49 |
The university may be interested in looking at CAPEs results by department.
| Quarter | Department | Recommend (%) | Expected Grade | Hours Per Week |
|---|---|---|---|---|
| SP22 | DSC | 91% | 3.01 (B) | 12.29 |
| SP22 | BILD | 85% | 2.78 (C+) | 13.21 |
Prospective students may be interested in comparing course evaluations across different universities.
| University | Recommend (%) | Average GPA | Hours Per Week |
|---|---|---|---|
| UC San Diego | 94% | 3.12 (B) | 42.19 |
| UC Irvine | 89% | 3.15 (B) | 38.44 |
| SDSU | 88% | 2.99 (B-) | 36.89 |
What is the average number of 'Years' for each 'Degree'? Write code that finds the answer as a Series indexed by 'Degree'.
profs = pd.DataFrame(
[['Brad', 'UCB', 8, 'Neuro', 'Orange'],
 ['Janine', 'UCSD', 7, 'Math', 'Purple'],
 ['Marina', 'UIC', 6, 'CS', 'Yellow'],
 ['Justin', 'OSU', 4, 'CS', 'Yellow'],
 ['Aaron', 'UCB', 4, 'Math', 'Purple'],
 ['Soohyun', 'UCSD', 1, 'CS', 'Orange'],
 ['Suraj', 'UCB', 1, 'CS', 'Purple']],
    columns=['Name', 'School', 'Years', 'Degree', 'Color']
)

profs
| Name | School | Years | Degree | Color | |
|---|---|---|---|---|---|
| 0 | Brad | UCB | 8 | Neuro | Orange |
| 1 | Janine | UCSD | 7 | Math | Purple |
| 2 | Marina | UIC | 6 | CS | Yellow |
| 3 | Justin | OSU | 4 | CS | Yellow |
| 4 | Aaron | UCB | 4 | Math | Purple |
| 5 | Soohyun | UCSD | 1 | CS | Orange |
| 6 | Suraj | UCB | 1 | CS | Purple |
year_map = {}
for degree in profs['Degree'].unique():
    degree_only = profs.loc[profs['Degree'] == degree]
    year_map[degree] = degree_only['Years'].mean()

pd.Series(year_map)
Neuro    8.0
Math     5.5
CS       3.0
dtype: float64
For each unique 'Degree', we make a pass through the entire dataset.
Let's try and avoid passing over the dataset repeatedly.
profs
| Name | School | Years | Degree | Color | |
|---|---|---|---|---|---|
| 0 | Brad | UCB | 8 | Neuro | Orange |
| 1 | Janine | UCSD | 7 | Math | Purple |
| 2 | Marina | UIC | 6 | CS | Yellow |
| 3 | Justin | OSU | 4 | CS | Yellow |
| 4 | Aaron | UCB | 4 | Math | Purple |
| 5 | Soohyun | UCSD | 1 | CS | Orange |
| 6 | Suraj | UCB | 1 | CS | Purple |
You can iterate over the rows of a DataFrame using the iterrows method (though you should rarely need to do this):
for idx, row in profs.iterrows():
    print(row, '\n')
Name        Brad
School       UCB
Years          8
Degree     Neuro
Color     Orange
Name: 0, dtype: object

Name      Janine
School      UCSD
Years          7
Degree      Math
Color     Purple
Name: 1, dtype: object

Name      Marina
School       UIC
Years          6
Degree        CS
Color     Yellow
Name: 2, dtype: object

Name      Justin
School       OSU
Years          4
Degree        CS
Color     Yellow
Name: 3, dtype: object

Name       Aaron
School       UCB
Years          4
Degree      Math
Color     Purple
Name: 4, dtype: object

Name      Soohyun
School       UCSD
Years           1
Degree         CS
Color      Orange
Name: 5, dtype: object

Name       Suraj
School       UCB
Years          1
Degree        CS
Color     Purple
Name: 6, dtype: object
year_map = {}
for idx, row in profs.iterrows():
    degree = row['Degree']
    person_years = row['Years']
    if degree in year_map:
        year_map[degree] += np.array([1, person_years])
    else:
        year_map[degree] = np.array([1, person_years])

year_map
{'Neuro': array([1, 8]), 'Math': array([ 2, 11]), 'CS': array([ 4, 12])}
df = pd.DataFrame(year_map, index=['total', 'years'])
df.loc['years'] / df.loc['total']
Neuro    8.0
Math     5.5
CS       3.0
dtype: float64
'Years' for each 'Degree'?profs
| Name | School | Years | Degree | Color | |
|---|---|---|---|---|---|
| 0 | Brad | UCB | 8 | Neuro | Orange |
| 1 | Janine | UCSD | 7 | Math | Purple |
| 2 | Marina | UIC | 6 | CS | Yellow |
| 3 | Justin | OSU | 4 | CS | Yellow |
| 4 | Aaron | UCB | 4 | Math | Purple |
| 5 | Soohyun | UCSD | 1 | CS | Orange |
| 6 | Suraj | UCB | 1 | CS | Purple |
profs.groupby('Degree').mean()
| Years | |
|---|---|
| Degree | |
| CS | 3.0 |
| Math | 5.5 |
| Neuro | 8.0 |
.csv files.groupby method involves three steps: split, apply, and combine.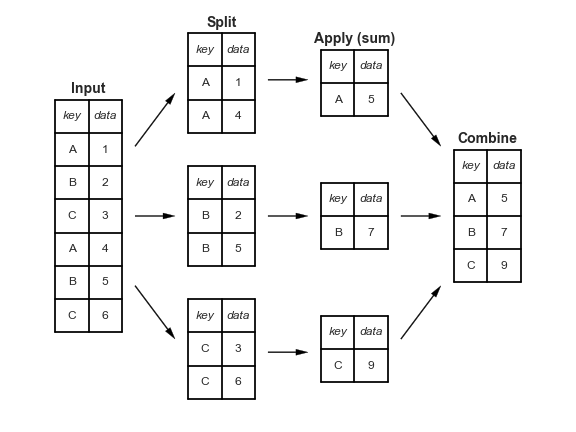
The groupby method can often produce results using just a single pass over the data, updating the sum, mean, count, min, or other aggregate for each group along the way.
groupby is a declarative operation – the user just specifies what computation needs to be done, and pandas figures out how to do it under the hood.
The split-apply-combine pattern can be parallelized to work on multiple computers or threads, by sending computations for each group to different processors.
penguins = sns.load_dataset('penguins').dropna()
penguins.head()
| species | island | bill_length_mm | bill_depth_mm | flipper_length_mm | body_mass_g | sex | |
|---|---|---|---|---|---|---|---|
| 0 | Adelie | Torgersen | 39.1 | 18.7 | 181.0 | 3750.0 | Male |
| 1 | Adelie | Torgersen | 39.5 | 17.4 | 186.0 | 3800.0 | Female |
| 2 | Adelie | Torgersen | 40.3 | 18.0 | 195.0 | 3250.0 | Female |
| 4 | Adelie | Torgersen | 36.7 | 19.3 | 193.0 | 3450.0 | Female |
| 5 | Adelie | Torgersen | 39.3 | 20.6 | 190.0 | 3650.0 | Male |
penguins['species'].value_counts()
Adelie       146
Gentoo       119
Chinstrap     68
Name: species, dtype: int64
penguins['island'].value_counts()
Biscoe       163
Dream        123
Torgersen     47
Name: island, dtype: int64
What is the median bill length?
penguins.groupby('species').median()
| bill_length_mm | bill_depth_mm | flipper_length_mm | body_mass_g | |
|---|---|---|---|---|
| species | ||||
| Adelie | 38.85 | 18.40 | 190.0 | 3700.0 |
| Chinstrap | 49.55 | 18.45 | 196.0 | 3700.0 |
| Gentoo | 47.40 | 15.00 | 216.0 | 5050.0 |
What proportion live on Dream Island?
(
    penguins.assign(on_Dream = penguins['island'] == 'Dream')
            .groupby('species')
            .mean()
)
| bill_length_mm | bill_depth_mm | flipper_length_mm | body_mass_g | on_Dream | |
|---|---|---|---|---|---|
| species | |||||
| Adelie | 38.823973 | 18.347260 | 190.102740 | 3706.164384 | 0.376712 |
| Chinstrap | 48.833824 | 18.420588 | 195.823529 | 3733.088235 | 1.000000 |
| Gentoo | 47.568067 | 14.996639 | 217.235294 | 5092.436975 | 0.000000 |
Now that we understand how to use groupby, let's dive deeper into how it works.
df is a DataFrame, then df.groupby(key) returns a DataFrameGroupBy object.DataFrameGroupBy objects:.groups: a dictionary in which the keys are group names and the values are lists of row labels..get_group(key): a DataFrame with only the values for the given keygroupby works.# Creates one group for each unique value in the species column
penguin_groups = penguins.groupby('species')
penguin_groups
<pandas.core.groupby.generic.DataFrameGroupBy object at 0x7fadf005c190>
penguin_groups.groups
{'Adelie': [0, 1, 2, 4, 5, 6, 7, 12, 13, 14, 15, 16, 17, 18, 19, 20, 21, 22, 23, 24, 25, 26, 27, 28, 29, 30, 31, 32, 33, 34, 35, 36, 37, 38, 39, 40, 41, 42, 43, 44, 45, 46, 48, 49, 50, 51, 52, 53, 54, 55, 56, 57, 58, 59, 60, 61, 62, 63, 64, 65, 66, 67, 68, 69, 70, 71, 72, 73, 74, 75, 76, 77, 78, 79, 80, 81, 82, 83, 84, 85, 86, 87, 88, 89, 90, 91, 92, 93, 94, 95, 96, 97, 98, 99, 100, 101, 102, 103, 104, 105, ...], 'Chinstrap': [152, 153, 154, 155, 156, 157, 158, 159, 160, 161, 162, 163, 164, 165, 166, 167, 168, 169, 170, 171, 172, 173, 174, 175, 176, 177, 178, 179, 180, 181, 182, 183, 184, 185, 186, 187, 188, 189, 190, 191, 192, 193, 194, 195, 196, 197, 198, 199, 200, 201, 202, 203, 204, 205, 206, 207, 208, 209, 210, 211, 212, 213, 214, 215, 216, 217, 218, 219], 'Gentoo': [220, 221, 222, 223, 224, 225, 226, 227, 228, 229, 230, 231, 232, 233, 234, 235, 236, 237, 238, 239, 240, 241, 242, 243, 244, 245, 247, 248, 249, 250, 251, 252, 253, 254, 255, 256, 257, 258, 259, 260, 261, 262, 263, 264, 265, 266, 267, 268, 269, 270, 271, 272, 273, 274, 275, 276, 277, 278, 279, 280, 281, 282, 283, 284, 285, 287, 288, 289, 290, 291, 292, 293, 294, 295, 296, 297, 298, 299, 300, 301, 302, 303, 304, 305, 306, 307, 308, 309, 310, 311, 312, 313, 314, 315, 316, 317, 318, 319, 320, 321, ...]}
penguin_groups.get_group('Chinstrap')
| species | island | bill_length_mm | bill_depth_mm | flipper_length_mm | body_mass_g | sex | |
|---|---|---|---|---|---|---|---|
| 152 | Chinstrap | Dream | 46.5 | 17.9 | 192.0 | 3500.0 | Female |
| 153 | Chinstrap | Dream | 50.0 | 19.5 | 196.0 | 3900.0 | Male |
| 154 | Chinstrap | Dream | 51.3 | 19.2 | 193.0 | 3650.0 | Male |
| 155 | Chinstrap | Dream | 45.4 | 18.7 | 188.0 | 3525.0 | Female |
| 156 | Chinstrap | Dream | 52.7 | 19.8 | 197.0 | 3725.0 | Male |
| ... | ... | ... | ... | ... | ... | ... | ... |
| 215 | Chinstrap | Dream | 55.8 | 19.8 | 207.0 | 4000.0 | Male |
| 216 | Chinstrap | Dream | 43.5 | 18.1 | 202.0 | 3400.0 | Female |
| 217 | Chinstrap | Dream | 49.6 | 18.2 | 193.0 | 3775.0 | Male |
| 218 | Chinstrap | Dream | 50.8 | 19.0 | 210.0 | 4100.0 | Male |
| 219 | Chinstrap | Dream | 50.2 | 18.7 | 198.0 | 3775.0 | Female |
68 rows × 7 columns
# Same as the above
penguins[penguins['species'] == 'Chinstrap']
| species | island | bill_length_mm | bill_depth_mm | flipper_length_mm | body_mass_g | sex | |
|---|---|---|---|---|---|---|---|
| 152 | Chinstrap | Dream | 46.5 | 17.9 | 192.0 | 3500.0 | Female |
| 153 | Chinstrap | Dream | 50.0 | 19.5 | 196.0 | 3900.0 | Male |
| 154 | Chinstrap | Dream | 51.3 | 19.2 | 193.0 | 3650.0 | Male |
| 155 | Chinstrap | Dream | 45.4 | 18.7 | 188.0 | 3525.0 | Female |
| 156 | Chinstrap | Dream | 52.7 | 19.8 | 197.0 | 3725.0 | Male |
| ... | ... | ... | ... | ... | ... | ... | ... |
| 215 | Chinstrap | Dream | 55.8 | 19.8 | 207.0 | 4000.0 | Male |
| 216 | Chinstrap | Dream | 43.5 | 18.1 | 202.0 | 3400.0 | Female |
| 217 | Chinstrap | Dream | 49.6 | 18.2 | 193.0 | 3775.0 | Male |
| 218 | Chinstrap | Dream | 50.8 | 19.0 | 210.0 | 4100.0 | Male |
| 219 | Chinstrap | Dream | 50.2 | 18.7 | 198.0 | 3775.0 | Female |
68 rows × 7 columns
for key, df in penguin_groups:
    display(df)
| species | island | bill_length_mm | bill_depth_mm | flipper_length_mm | body_mass_g | sex | |
|---|---|---|---|---|---|---|---|
| 0 | Adelie | Torgersen | 39.1 | 18.7 | 181.0 | 3750.0 | Male |
| 1 | Adelie | Torgersen | 39.5 | 17.4 | 186.0 | 3800.0 | Female |
| 2 | Adelie | Torgersen | 40.3 | 18.0 | 195.0 | 3250.0 | Female |
| 4 | Adelie | Torgersen | 36.7 | 19.3 | 193.0 | 3450.0 | Female |
| 5 | Adelie | Torgersen | 39.3 | 20.6 | 190.0 | 3650.0 | Male |
| ... | ... | ... | ... | ... | ... | ... | ... |
| 147 | Adelie | Dream | 36.6 | 18.4 | 184.0 | 3475.0 | Female |
| 148 | Adelie | Dream | 36.0 | 17.8 | 195.0 | 3450.0 | Female |
| 149 | Adelie | Dream | 37.8 | 18.1 | 193.0 | 3750.0 | Male |
| 150 | Adelie | Dream | 36.0 | 17.1 | 187.0 | 3700.0 | Female |
| 151 | Adelie | Dream | 41.5 | 18.5 | 201.0 | 4000.0 | Male |
146 rows × 7 columns
| species | island | bill_length_mm | bill_depth_mm | flipper_length_mm | body_mass_g | sex | |
|---|---|---|---|---|---|---|---|
| 152 | Chinstrap | Dream | 46.5 | 17.9 | 192.0 | 3500.0 | Female |
| 153 | Chinstrap | Dream | 50.0 | 19.5 | 196.0 | 3900.0 | Male |
| 154 | Chinstrap | Dream | 51.3 | 19.2 | 193.0 | 3650.0 | Male |
| 155 | Chinstrap | Dream | 45.4 | 18.7 | 188.0 | 3525.0 | Female |
| 156 | Chinstrap | Dream | 52.7 | 19.8 | 197.0 | 3725.0 | Male |
| ... | ... | ... | ... | ... | ... | ... | ... |
| 215 | Chinstrap | Dream | 55.8 | 19.8 | 207.0 | 4000.0 | Male |
| 216 | Chinstrap | Dream | 43.5 | 18.1 | 202.0 | 3400.0 | Female |
| 217 | Chinstrap | Dream | 49.6 | 18.2 | 193.0 | 3775.0 | Male |
| 218 | Chinstrap | Dream | 50.8 | 19.0 | 210.0 | 4100.0 | Male |
| 219 | Chinstrap | Dream | 50.2 | 18.7 | 198.0 | 3775.0 | Female |
68 rows × 7 columns
| species | island | bill_length_mm | bill_depth_mm | flipper_length_mm | body_mass_g | sex | |
|---|---|---|---|---|---|---|---|
| 220 | Gentoo | Biscoe | 46.1 | 13.2 | 211.0 | 4500.0 | Female |
| 221 | Gentoo | Biscoe | 50.0 | 16.3 | 230.0 | 5700.0 | Male |
| 222 | Gentoo | Biscoe | 48.7 | 14.1 | 210.0 | 4450.0 | Female |
| 223 | Gentoo | Biscoe | 50.0 | 15.2 | 218.0 | 5700.0 | Male |
| 224 | Gentoo | Biscoe | 47.6 | 14.5 | 215.0 | 5400.0 | Male |
| ... | ... | ... | ... | ... | ... | ... | ... |
| 338 | Gentoo | Biscoe | 47.2 | 13.7 | 214.0 | 4925.0 | Female |
| 340 | Gentoo | Biscoe | 46.8 | 14.3 | 215.0 | 4850.0 | Female |
| 341 | Gentoo | Biscoe | 50.4 | 15.7 | 222.0 | 5750.0 | Male |
| 342 | Gentoo | Biscoe | 45.2 | 14.8 | 212.0 | 5200.0 | Female |
| 343 | Gentoo | Biscoe | 49.9 | 16.1 | 213.0 | 5400.0 | Male |
119 rows × 7 columns
DataFrameGroupBy object, we need to apply some function to each group, and combine the results.DataFrameGroupBy object, e.g. .mean(), .max(), .median(), etc.penguins
| species | island | bill_length_mm | bill_depth_mm | flipper_length_mm | body_mass_g | sex | |
|---|---|---|---|---|---|---|---|
| 0 | Adelie | Torgersen | 39.1 | 18.7 | 181.0 | 3750.0 | Male |
| 1 | Adelie | Torgersen | 39.5 | 17.4 | 186.0 | 3800.0 | Female |
| 2 | Adelie | Torgersen | 40.3 | 18.0 | 195.0 | 3250.0 | Female |
| 4 | Adelie | Torgersen | 36.7 | 19.3 | 193.0 | 3450.0 | Female |
| 5 | Adelie | Torgersen | 39.3 | 20.6 | 190.0 | 3650.0 | Male |
| ... | ... | ... | ... | ... | ... | ... | ... |
| 338 | Gentoo | Biscoe | 47.2 | 13.7 | 214.0 | 4925.0 | Female |
| 340 | Gentoo | Biscoe | 46.8 | 14.3 | 215.0 | 4850.0 | Female |
| 341 | Gentoo | Biscoe | 50.4 | 15.7 | 222.0 | 5750.0 | Male |
| 342 | Gentoo | Biscoe | 45.2 | 14.8 | 212.0 | 5200.0 | Female |
| 343 | Gentoo | Biscoe | 49.9 | 16.1 | 213.0 | 5400.0 | Male |
333 rows × 7 columns
penguin_groups
<pandas.core.groupby.generic.DataFrameGroupBy object at 0x7fadf005c190>
penguin_groups.mean()
| bill_length_mm | bill_depth_mm | flipper_length_mm | body_mass_g | |
|---|---|---|---|---|
| species | ||||
| Adelie | 38.823973 | 18.347260 | 190.102740 | 3706.164384 |
| Chinstrap | 48.833824 | 18.420588 | 195.823529 | 3733.088235 |
| Gentoo | 47.568067 | 14.996639 | 217.235294 | 5092.436975 |
penguin_groups.sum()
| bill_length_mm | bill_depth_mm | flipper_length_mm | body_mass_g | |
|---|---|---|---|---|
| species | ||||
| Adelie | 5668.3 | 2678.7 | 27755.0 | 541100.0 |
| Chinstrap | 3320.7 | 1252.6 | 13316.0 | 253850.0 |
| Gentoo | 5660.6 | 1784.6 | 25851.0 | 606000.0 |
penguin_groups.max()
| island | bill_length_mm | bill_depth_mm | flipper_length_mm | body_mass_g | sex | |
|---|---|---|---|---|---|---|
| species | ||||||
| Adelie | Torgersen | 46.0 | 21.5 | 210.0 | 4775.0 | Male |
| Chinstrap | Dream | 58.0 | 20.8 | 212.0 | 4800.0 | Male |
| Gentoo | Biscoe | 59.6 | 17.3 | 231.0 | 6300.0 | Male |
max and min are defined on strings, while median and mean are not.DataFrameGroupBy objects support [] notation.penguins.groupby('species').median()
| bill_length_mm | bill_depth_mm | flipper_length_mm | body_mass_g | |
|---|---|---|---|---|
| species | ||||
| Adelie | 38.85 | 18.40 | 190.0 | 3700.0 |
| Chinstrap | 49.55 | 18.45 | 196.0 | 3700.0 |
| Gentoo | 47.40 | 15.00 | 216.0 | 5050.0 |
penguins.groupby('species')['bill_length_mm'].median()
species
Adelie       38.85
Chinstrap    49.55
Gentoo       47.40
Name: bill_length_mm, dtype: float64
# Gives the same result, but involves wasted effort
# since the other columns had to be aggregated for no reason
penguins.groupby('species').median()['bill_length_mm']
species
Adelie       38.85
Chinstrap    49.55
Gentoo       47.40
Name: bill_length_mm, dtype: float64
# Note that this is a SeriesGroupBy object, not a DataFrameGroupBy object!
penguins.groupby('species')['bill_length_mm']
<pandas.core.groupby.generic.SeriesGroupBy object at 0x7fae21144790>
GroupBy methods¶pandas?aggregate method¶DataFrameGroupBy object has a general aggregate method, which aggregates using one or more operations.aggregate; refer to the documentation for a comprehensive list.agg is an alias for aggregate.How many penguins are there of each species, and what is the mean body mass of each species?
penguins.groupby('species')['body_mass_g'].aggregate(['count', 'mean'])
| count | mean | |
|---|---|---|
| species | ||
| Adelie | 146 | 3706.164384 |
| Chinstrap | 68 | 3733.088235 |
| Gentoo | 119 | 5092.436975 |
Note what happens when we don't select a column before aggregating.
# penguins.drop(columns=['island', 'sex']).groupby('species').aggregate(['count', 'mean'])
penguins.groupby('species').aggregate(['count', 'mean'])
/var/folders/pd/w73mdrsj2836_7gp0brr2q7r0000gn/T/ipykernel_19120/3019667236.py:2: FutureWarning: ['island', 'sex'] did not aggregate successfully. If any error is raised this will raise in a future version of pandas. Drop these columns/ops to avoid this warning.
  penguins.groupby('species').aggregate(['count', 'mean'])
| bill_length_mm | bill_depth_mm | flipper_length_mm | body_mass_g | |||||
|---|---|---|---|---|---|---|---|---|
| count | mean | count | mean | count | mean | count | mean | |
| species | ||||||||
| Adelie | 146 | 38.823973 | 146 | 18.347260 | 146 | 190.102740 | 146 | 3706.164384 |
| Chinstrap | 68 | 48.833824 | 68 | 18.420588 | 68 | 195.823529 | 68 | 3733.088235 |
| Gentoo | 119 | 47.568067 | 119 | 14.996639 | 119 | 217.235294 | 119 | 5092.436975 |
What is the max bill length of each species, and how many islands is each species found on?
penguins.groupby('species').aggregate({'bill_length_mm': 'max', 'island': 'nunique'})
| bill_length_mm | island | |
|---|---|---|
| species | ||
| Adelie | 46.0 | 3 |
| Chinstrap | 58.0 | 1 |
| Gentoo | 59.6 | 1 |
What is the interquartile range of the body mass of each species?
def IQR(col):
    return np.percentile(col, 75) - np.percentile(col, 25)
penguins.groupby('species')['body_mass_g'].aggregate(IQR)
species
Adelie       637.5
Chinstrap    462.5
Gentoo       800.0
Name: body_mass_g, dtype: float64
transform method¶penguins
| species | island | bill_length_mm | bill_depth_mm | flipper_length_mm | body_mass_g | sex | |
|---|---|---|---|---|---|---|---|
| 0 | Adelie | Torgersen | 39.1 | 18.7 | 181.0 | 3750.0 | Male |
| 1 | Adelie | Torgersen | 39.5 | 17.4 | 186.0 | 3800.0 | Female |
| 2 | Adelie | Torgersen | 40.3 | 18.0 | 195.0 | 3250.0 | Female |
| 4 | Adelie | Torgersen | 36.7 | 19.3 | 193.0 | 3450.0 | Female |
| 5 | Adelie | Torgersen | 39.3 | 20.6 | 190.0 | 3650.0 | Male |
| ... | ... | ... | ... | ... | ... | ... | ... |
| 338 | Gentoo | Biscoe | 47.2 | 13.7 | 214.0 | 4925.0 | Female |
| 340 | Gentoo | Biscoe | 46.8 | 14.3 | 215.0 | 4850.0 | Female |
| 341 | Gentoo | Biscoe | 50.4 | 15.7 | 222.0 | 5750.0 | Male |
| 342 | Gentoo | Biscoe | 45.2 | 14.8 | 212.0 | 5200.0 | Female |
| 343 | Gentoo | Biscoe | 49.9 | 16.1 | 213.0 | 5400.0 | Male |
333 rows × 7 columns
penguins.groupby('species')['body_mass_g'].transform(lambda ser: ser - ser.mean())
0       43.835616
1       93.835616
2     -456.164384
4     -256.164384
5      -56.164384
          ...
338   -167.436975
340   -242.436975
341    657.563025
342    107.563025
343    307.563025
Name: body_mass_g, Length: 333, dtype: float64
filter method¶filter method, which takes in a function.True.penguins
| species | island | bill_length_mm | bill_depth_mm | flipper_length_mm | body_mass_g | sex | |
|---|---|---|---|---|---|---|---|
| 0 | Adelie | Torgersen | 39.1 | 18.7 | 181.0 | 3750.0 | Male |
| 1 | Adelie | Torgersen | 39.5 | 17.4 | 186.0 | 3800.0 | Female |
| 2 | Adelie | Torgersen | 40.3 | 18.0 | 195.0 | 3250.0 | Female |
| 4 | Adelie | Torgersen | 36.7 | 19.3 | 193.0 | 3450.0 | Female |
| 5 | Adelie | Torgersen | 39.3 | 20.6 | 190.0 | 3650.0 | Male |
| ... | ... | ... | ... | ... | ... | ... | ... |
| 338 | Gentoo | Biscoe | 47.2 | 13.7 | 214.0 | 4925.0 | Female |
| 340 | Gentoo | Biscoe | 46.8 | 14.3 | 215.0 | 4850.0 | Female |
| 341 | Gentoo | Biscoe | 50.4 | 15.7 | 222.0 | 5750.0 | Male |
| 342 | Gentoo | Biscoe | 45.2 | 14.8 | 212.0 | 5200.0 | Female |
| 343 | Gentoo | Biscoe | 49.9 | 16.1 | 213.0 | 5400.0 | Male |
333 rows × 7 columns
penguins.groupby('species').filter(lambda df: df['bill_length_mm'].mean() > 39)
| species | island | bill_length_mm | bill_depth_mm | flipper_length_mm | body_mass_g | sex | |
|---|---|---|---|---|---|---|---|
| 152 | Chinstrap | Dream | 46.5 | 17.9 | 192.0 | 3500.0 | Female |
| 153 | Chinstrap | Dream | 50.0 | 19.5 | 196.0 | 3900.0 | Male |
| 154 | Chinstrap | Dream | 51.3 | 19.2 | 193.0 | 3650.0 | Male |
| 155 | Chinstrap | Dream | 45.4 | 18.7 | 188.0 | 3525.0 | Female |
| 156 | Chinstrap | Dream | 52.7 | 19.8 | 197.0 | 3725.0 | Male |
| ... | ... | ... | ... | ... | ... | ... | ... |
| 338 | Gentoo | Biscoe | 47.2 | 13.7 | 214.0 | 4925.0 | Female |
| 340 | Gentoo | Biscoe | 46.8 | 14.3 | 215.0 | 4850.0 | Female |
| 341 | Gentoo | Biscoe | 50.4 | 15.7 | 222.0 | 5750.0 | Male |
| 342 | Gentoo | Biscoe | 45.2 | 14.8 | 212.0 | 5200.0 | Female |
| 343 | Gentoo | Biscoe | 49.9 | 16.1 | 213.0 | 5400.0 | Male |
187 rows × 7 columns
No more Adelies!
apply method¶apply method is a generalization of aggregate, transform, and filter.apply.penguins.groupby('species').apply(lambda s: s * 2)
| species | island | bill_length_mm | bill_depth_mm | flipper_length_mm | body_mass_g | sex | |
|---|---|---|---|---|---|---|---|
| 0 | AdelieAdelie | TorgersenTorgersen | 78.2 | 37.4 | 362.0 | 7500.0 | MaleMale |
| 1 | AdelieAdelie | TorgersenTorgersen | 79.0 | 34.8 | 372.0 | 7600.0 | FemaleFemale |
| 2 | AdelieAdelie | TorgersenTorgersen | 80.6 | 36.0 | 390.0 | 6500.0 | FemaleFemale |
| 4 | AdelieAdelie | TorgersenTorgersen | 73.4 | 38.6 | 386.0 | 6900.0 | FemaleFemale |
| 5 | AdelieAdelie | TorgersenTorgersen | 78.6 | 41.2 | 380.0 | 7300.0 | MaleMale |
| ... | ... | ... | ... | ... | ... | ... | ... |
| 338 | GentooGentoo | BiscoeBiscoe | 94.4 | 27.4 | 428.0 | 9850.0 | FemaleFemale |
| 340 | GentooGentoo | BiscoeBiscoe | 93.6 | 28.6 | 430.0 | 9700.0 | FemaleFemale |
| 341 | GentooGentoo | BiscoeBiscoe | 100.8 | 31.4 | 444.0 | 11500.0 | MaleMale |
| 342 | GentooGentoo | BiscoeBiscoe | 90.4 | 29.6 | 424.0 | 10400.0 | FemaleFemale |
| 343 | GentooGentoo | BiscoeBiscoe | 99.8 | 32.2 | 426.0 | 10800.0 | MaleMale |
333 rows × 7 columns
penguins.groupby('species').apply(lambda s: s.mean().mean())
/var/folders/pd/w73mdrsj2836_7gp0brr2q7r0000gn/T/ipykernel_19120/2735591403.py:1: FutureWarning: Dropping of nuisance columns in DataFrame reductions (with 'numeric_only=None') is deprecated; in a future version this will raise TypeError.  Select only valid columns before calling the reduction.
  penguins.groupby('species').apply(lambda s: s.mean().mean())
species
Adelie        988.359589
Chinstrap     999.041544
Gentoo       1343.059244
dtype: float64
For each species, find the island on which the heaviest penguin of that species lives.
# Why doesn't this work?
penguins.groupby('species').max()
| island | bill_length_mm | bill_depth_mm | flipper_length_mm | body_mass_g | sex | |
|---|---|---|---|---|---|---|
| species | ||||||
| Adelie | Torgersen | 46.0 | 21.5 | 210.0 | 4775.0 | Male |
| Chinstrap | Dream | 58.0 | 20.8 | 212.0 | 4800.0 | Male |
| Gentoo | Biscoe | 59.6 | 17.3 | 231.0 | 6300.0 | Male |
penguins.sort_values('body_mass_g', ascending=False).groupby('species').first()
| island | bill_length_mm | bill_depth_mm | flipper_length_mm | body_mass_g | sex | |
|---|---|---|---|---|---|---|
| species | ||||||
| Adelie | Biscoe | 43.2 | 19.0 | 197.0 | 4775.0 | Male |
| Chinstrap | Dream | 52.0 | 20.7 | 210.0 | 4800.0 | Male |
| Gentoo | Biscoe | 49.2 | 15.2 | 221.0 | 6300.0 | Male |
When we group with multiple columns, one group is created for every unique combination of elements in the specified columns.
double_group = penguins.groupby(['species', 'island'])
double_group
<pandas.core.groupby.generic.DataFrameGroupBy object at 0x7fae133cea90>
double_group.groups
{('Adelie', 'Biscoe'): [20, 21, 22, 23, 24, 25, 26, 27, 28, 29, 50, 51, 52, 53, 54, 55, 56, 57, 58, 59, 60, 61, 62, 63, 64, 65, 66, 67, 100, 101, 102, 103, 104, 105, 106, 107, 108, 109, 110, 111, 112, 113, 114, 115], ('Adelie', 'Dream'): [30, 31, 32, 33, 34, 35, 36, 37, 38, 39, 40, 41, 42, 43, 44, 45, 46, 48, 49, 84, 85, 86, 87, 88, 89, 90, 91, 92, 93, 94, 95, 96, 97, 98, 99, 132, 133, 134, 135, 136, 137, 138, 139, 140, 141, 142, 143, 144, 145, 146, 147, 148, 149, 150, 151], ('Adelie', 'Torgersen'): [0, 1, 2, 4, 5, 6, 7, 12, 13, 14, 15, 16, 17, 18, 19, 68, 69, 70, 71, 72, 73, 74, 75, 76, 77, 78, 79, 80, 81, 82, 83, 116, 117, 118, 119, 120, 121, 122, 123, 124, 125, 126, 127, 128, 129, 130, 131], ('Chinstrap', 'Dream'): [152, 153, 154, 155, 156, 157, 158, 159, 160, 161, 162, 163, 164, 165, 166, 167, 168, 169, 170, 171, 172, 173, 174, 175, 176, 177, 178, 179, 180, 181, 182, 183, 184, 185, 186, 187, 188, 189, 190, 191, 192, 193, 194, 195, 196, 197, 198, 199, 200, 201, 202, 203, 204, 205, 206, 207, 208, 209, 210, 211, 212, 213, 214, 215, 216, 217, 218, 219], ('Gentoo', 'Biscoe'): [220, 221, 222, 223, 224, 225, 226, 227, 228, 229, 230, 231, 232, 233, 234, 235, 236, 237, 238, 239, 240, 241, 242, 243, 244, 245, 247, 248, 249, 250, 251, 252, 253, 254, 255, 256, 257, 258, 259, 260, 261, 262, 263, 264, 265, 266, 267, 268, 269, 270, 271, 272, 273, 274, 275, 276, 277, 278, 279, 280, 281, 282, 283, 284, 285, 287, 288, 289, 290, 291, 292, 293, 294, 295, 296, 297, 298, 299, 300, 301, 302, 303, 304, 305, 306, 307, 308, 309, 310, 311, 312, 313, 314, 315, 316, 317, 318, 319, 320, 321, ...]}
for key, df in double_group:
    display(df.head())
| species | island | bill_length_mm | bill_depth_mm | flipper_length_mm | body_mass_g | sex | |
|---|---|---|---|---|---|---|---|
| 20 | Adelie | Biscoe | 37.8 | 18.3 | 174.0 | 3400.0 | Female |
| 21 | Adelie | Biscoe | 37.7 | 18.7 | 180.0 | 3600.0 | Male |
| 22 | Adelie | Biscoe | 35.9 | 19.2 | 189.0 | 3800.0 | Female |
| 23 | Adelie | Biscoe | 38.2 | 18.1 | 185.0 | 3950.0 | Male |
| 24 | Adelie | Biscoe | 38.8 | 17.2 | 180.0 | 3800.0 | Male |
| species | island | bill_length_mm | bill_depth_mm | flipper_length_mm | body_mass_g | sex | |
|---|---|---|---|---|---|---|---|
| 30 | Adelie | Dream | 39.5 | 16.7 | 178.0 | 3250.0 | Female |
| 31 | Adelie | Dream | 37.2 | 18.1 | 178.0 | 3900.0 | Male |
| 32 | Adelie | Dream | 39.5 | 17.8 | 188.0 | 3300.0 | Female |
| 33 | Adelie | Dream | 40.9 | 18.9 | 184.0 | 3900.0 | Male |
| 34 | Adelie | Dream | 36.4 | 17.0 | 195.0 | 3325.0 | Female |
| species | island | bill_length_mm | bill_depth_mm | flipper_length_mm | body_mass_g | sex | |
|---|---|---|---|---|---|---|---|
| 0 | Adelie | Torgersen | 39.1 | 18.7 | 181.0 | 3750.0 | Male |
| 1 | Adelie | Torgersen | 39.5 | 17.4 | 186.0 | 3800.0 | Female |
| 2 | Adelie | Torgersen | 40.3 | 18.0 | 195.0 | 3250.0 | Female |
| 4 | Adelie | Torgersen | 36.7 | 19.3 | 193.0 | 3450.0 | Female |
| 5 | Adelie | Torgersen | 39.3 | 20.6 | 190.0 | 3650.0 | Male |
| species | island | bill_length_mm | bill_depth_mm | flipper_length_mm | body_mass_g | sex | |
|---|---|---|---|---|---|---|---|
| 152 | Chinstrap | Dream | 46.5 | 17.9 | 192.0 | 3500.0 | Female |
| 153 | Chinstrap | Dream | 50.0 | 19.5 | 196.0 | 3900.0 | Male |
| 154 | Chinstrap | Dream | 51.3 | 19.2 | 193.0 | 3650.0 | Male |
| 155 | Chinstrap | Dream | 45.4 | 18.7 | 188.0 | 3525.0 | Female |
| 156 | Chinstrap | Dream | 52.7 | 19.8 | 197.0 | 3725.0 | Male |
| species | island | bill_length_mm | bill_depth_mm | flipper_length_mm | body_mass_g | sex | |
|---|---|---|---|---|---|---|---|
| 220 | Gentoo | Biscoe | 46.1 | 13.2 | 211.0 | 4500.0 | Female |
| 221 | Gentoo | Biscoe | 50.0 | 16.3 | 230.0 | 5700.0 | Male |
| 222 | Gentoo | Biscoe | 48.7 | 14.1 | 210.0 | 4450.0 | Female |
| 223 | Gentoo | Biscoe | 50.0 | 15.2 | 218.0 | 5700.0 | Male |
| 224 | Gentoo | Biscoe | 47.6 | 14.5 | 215.0 | 5400.0 | Male |
penguins.groupby(['species', 'island']).mean()
| bill_length_mm | bill_depth_mm | flipper_length_mm | body_mass_g | ||
|---|---|---|---|---|---|
| species | island | ||||
| Adelie | Biscoe | 38.975000 | 18.370455 | 188.795455 | 3709.659091 |
| Dream | 38.520000 | 18.240000 | 189.927273 | 3701.363636 | |
| Torgersen | 39.038298 | 18.451064 | 191.531915 | 3708.510638 | |
| Chinstrap | Dream | 48.833824 | 18.420588 | 195.823529 | 3733.088235 |
| Gentoo | Biscoe | 47.568067 | 14.996639 | 217.235294 | 5092.436975 |
groupby method creates an index based on the specified columns.MultiIndex.MultiIndex, use reset_index or set as_index=False in groupby.weird = penguins.groupby(['species', 'island']).mean()
weird
| bill_length_mm | bill_depth_mm | flipper_length_mm | body_mass_g | ||
|---|---|---|---|---|---|
| species | island | ||||
| Adelie | Biscoe | 38.975000 | 18.370455 | 188.795455 | 3709.659091 |
| Dream | 38.520000 | 18.240000 | 189.927273 | 3701.363636 | |
| Torgersen | 39.038298 | 18.451064 | 191.531915 | 3708.510638 | |
| Chinstrap | Dream | 48.833824 | 18.420588 | 195.823529 | 3733.088235 |
| Gentoo | Biscoe | 47.568067 | 14.996639 | 217.235294 | 5092.436975 |
weird['body_mass_g']
species    island
Adelie     Biscoe       3709.659091
           Dream        3701.363636
           Torgersen    3708.510638
Chinstrap  Dream        3733.088235
Gentoo     Biscoe       5092.436975
Name: body_mass_g, dtype: float64
weird.loc['Adelie']
| bill_length_mm | bill_depth_mm | flipper_length_mm | body_mass_g | |
|---|---|---|---|---|
| island | ||||
| Biscoe | 38.975000 | 18.370455 | 188.795455 | 3709.659091 |
| Dream | 38.520000 | 18.240000 | 189.927273 | 3701.363636 |
| Torgersen | 39.038298 | 18.451064 | 191.531915 | 3708.510638 |
weird.loc[('Adelie', 'Torgersen')]
bill_length_mm         39.038298
bill_depth_mm          18.451064
flipper_length_mm     191.531915
body_mass_g          3708.510638
Name: (Adelie, Torgersen), dtype: float64
weird.reset_index()
| species | island | bill_length_mm | bill_depth_mm | flipper_length_mm | body_mass_g | |
|---|---|---|---|---|---|---|
| 0 | Adelie | Biscoe | 38.975000 | 18.370455 | 188.795455 | 3709.659091 |
| 1 | Adelie | Dream | 38.520000 | 18.240000 | 189.927273 | 3701.363636 |
| 2 | Adelie | Torgersen | 39.038298 | 18.451064 | 191.531915 | 3708.510638 |
| 3 | Chinstrap | Dream | 48.833824 | 18.420588 | 195.823529 | 3733.088235 |
| 4 | Gentoo | Biscoe | 47.568067 | 14.996639 | 217.235294 | 5092.436975 |
penguins.groupby(['species', 'island'], as_index=False).mean()
| species | island | bill_length_mm | bill_depth_mm | flipper_length_mm | body_mass_g | |
|---|---|---|---|---|---|---|
| 0 | Adelie | Biscoe | 38.975000 | 18.370455 | 188.795455 | 3709.659091 |
| 1 | Adelie | Dream | 38.520000 | 18.240000 | 189.927273 | 3701.363636 |
| 2 | Adelie | Torgersen | 39.038298 | 18.451064 | 191.531915 | 3708.510638 |
| 3 | Chinstrap | Dream | 48.833824 | 18.420588 | 195.823529 | 3733.088235 |
| 4 | Gentoo | Biscoe | 47.568067 | 14.996639 | 217.235294 | 5092.436975 |
To find the above information, we can group by both 'species' and 'island'.
penguins.groupby(['species', 'island'])['body_mass_g'].mean()
species    island
Adelie     Biscoe       3709.659091
           Dream        3701.363636
           Torgersen    3708.510638
Chinstrap  Dream        3733.088235
Gentoo     Biscoe       5092.436975
Name: body_mass_g, dtype: float64
But we can also create a pivot table.
penguins.pivot_table(index='species',
                     columns='island',
                     values='body_mass_g',
                     aggfunc='mean')
| island | Biscoe | Dream | Torgersen |
|---|---|---|---|
| species | |||
| Adelie | 3709.659091 | 3701.363636 | 3708.510638 |
| Chinstrap | NaN | 3733.088235 | NaN |
| Gentoo | 5092.436975 | NaN | NaN |
Note that the DataFrame above shows the same information as the Series above it, just in a different arrangement.
groupby method returns a DataFrameGroupBy method, which creates one group for every unique combination of values in the column(s) being grouped on.DataFrameGroupBy object, but we can also use transform, filter, or the more general apply methods. Each one of these methods acts on each group individually.pivot and pivot_table. Simpson's paradox. Combining DataFrames.