Example: Tic-tac-toe

import pandas as pd
import numpy as np
import os
import seaborn as sns

from IPython.display import display, IFrame
def show_paradox_slides():
    src = 'https://docs.google.com/presentation/d/e/2PACX-1vSbFSaxaYZ0NcgrgqZLvjhkjX-5MQzAITWAsEFZHnix3j1c0qN8Vd1rogTAQP7F7Nf5r-JWExnGey7h/embed?start=false'
    width = 960
    height = 569
    display(IFrame(src, width, height))
penguins = sns.load_dataset('penguins').dropna()
penguins.head()
| species | island | bill_length_mm | bill_depth_mm | flipper_length_mm | body_mass_g | sex | |
|---|---|---|---|---|---|---|---|
| 0 | Adelie | Torgersen | 39.1 | 18.7 | 181.0 | 3750.0 | Male |
| 1 | Adelie | Torgersen | 39.5 | 17.4 | 186.0 | 3800.0 | Female |
| 2 | Adelie | Torgersen | 40.3 | 18.0 | 195.0 | 3250.0 | Female |
| 4 | Adelie | Torgersen | 36.7 | 19.3 | 193.0 | 3450.0 | Female |
| 5 | Adelie | Torgersen | 39.3 | 20.6 | 190.0 | 3650.0 | Male |
For each species, find the island on which the heaviest penguin of that species lives.
# Why doesn't this work?
penguins.groupby('species').max()
| island | bill_length_mm | bill_depth_mm | flipper_length_mm | body_mass_g | sex | |
|---|---|---|---|---|---|---|
| species | ||||||
| Adelie | Torgersen | 46.0 | 21.5 | 210.0 | 4775.0 | Male |
| Chinstrap | Dream | 58.0 | 20.8 | 212.0 | 4800.0 | Male |
| Gentoo | Biscoe | 59.6 | 17.3 | 231.0 | 6300.0 | Male |
penguins.sort_values('body_mass_g', ascending=False).groupby('species').first()
| island | bill_length_mm | bill_depth_mm | flipper_length_mm | body_mass_g | sex | |
|---|---|---|---|---|---|---|
| species | ||||||
| Adelie | Biscoe | 43.2 | 19.0 | 197.0 | 4775.0 | Male |
| Chinstrap | Dream | 52.0 | 20.7 | 210.0 | 4800.0 | Male |
| Gentoo | Biscoe | 49.2 | 15.2 | 221.0 | 6300.0 | Male |
When we group with multiple columns, one group is created for every unique combination of elements in the specified columns.
double_group = penguins.groupby(['species', 'island'])
double_group
<pandas.core.groupby.generic.DataFrameGroupBy object at 0x7fe2d0178b20>
double_group.groups
{('Adelie', 'Biscoe'): [20, 21, 22, 23, 24, 25, 26, 27, 28, 29, 50, 51, 52, 53, 54, 55, 56, 57, 58, 59, 60, 61, 62, 63, 64, 65, 66, 67, 100, 101, 102, 103, 104, 105, 106, 107, 108, 109, 110, 111, 112, 113, 114, 115], ('Adelie', 'Dream'): [30, 31, 32, 33, 34, 35, 36, 37, 38, 39, 40, 41, 42, 43, 44, 45, 46, 48, 49, 84, 85, 86, 87, 88, 89, 90, 91, 92, 93, 94, 95, 96, 97, 98, 99, 132, 133, 134, 135, 136, 137, 138, 139, 140, 141, 142, 143, 144, 145, 146, 147, 148, 149, 150, 151], ('Adelie', 'Torgersen'): [0, 1, 2, 4, 5, 6, 7, 12, 13, 14, 15, 16, 17, 18, 19, 68, 69, 70, 71, 72, 73, 74, 75, 76, 77, 78, 79, 80, 81, 82, 83, 116, 117, 118, 119, 120, 121, 122, 123, 124, 125, 126, 127, 128, 129, 130, 131], ('Chinstrap', 'Dream'): [152, 153, 154, 155, 156, 157, 158, 159, 160, 161, 162, 163, 164, 165, 166, 167, 168, 169, 170, 171, 172, 173, 174, 175, 176, 177, 178, 179, 180, 181, 182, 183, 184, 185, 186, 187, 188, 189, 190, 191, 192, 193, 194, 195, 196, 197, 198, 199, 200, 201, 202, 203, 204, 205, 206, 207, 208, 209, 210, 211, 212, 213, 214, 215, 216, 217, 218, 219], ('Gentoo', 'Biscoe'): [220, 221, 222, 223, 224, 225, 226, 227, 228, 229, 230, 231, 232, 233, 234, 235, 236, 237, 238, 239, 240, 241, 242, 243, 244, 245, 247, 248, 249, 250, 251, 252, 253, 254, 255, 256, 257, 258, 259, 260, 261, 262, 263, 264, 265, 266, 267, 268, 269, 270, 271, 272, 273, 274, 275, 276, 277, 278, 279, 280, 281, 282, 283, 284, 285, 287, 288, 289, 290, 291, 292, 293, 294, 295, 296, 297, 298, 299, 300, 301, 302, 303, 304, 305, 306, 307, 308, 309, 310, 311, 312, 313, 314, 315, 316, 317, 318, 319, 320, 321, ...]}
for key, df in double_group:
    display(df.head())
| species | island | bill_length_mm | bill_depth_mm | flipper_length_mm | body_mass_g | sex | |
|---|---|---|---|---|---|---|---|
| 20 | Adelie | Biscoe | 37.8 | 18.3 | 174.0 | 3400.0 | Female |
| 21 | Adelie | Biscoe | 37.7 | 18.7 | 180.0 | 3600.0 | Male |
| 22 | Adelie | Biscoe | 35.9 | 19.2 | 189.0 | 3800.0 | Female |
| 23 | Adelie | Biscoe | 38.2 | 18.1 | 185.0 | 3950.0 | Male |
| 24 | Adelie | Biscoe | 38.8 | 17.2 | 180.0 | 3800.0 | Male |
| species | island | bill_length_mm | bill_depth_mm | flipper_length_mm | body_mass_g | sex | |
|---|---|---|---|---|---|---|---|
| 30 | Adelie | Dream | 39.5 | 16.7 | 178.0 | 3250.0 | Female |
| 31 | Adelie | Dream | 37.2 | 18.1 | 178.0 | 3900.0 | Male |
| 32 | Adelie | Dream | 39.5 | 17.8 | 188.0 | 3300.0 | Female |
| 33 | Adelie | Dream | 40.9 | 18.9 | 184.0 | 3900.0 | Male |
| 34 | Adelie | Dream | 36.4 | 17.0 | 195.0 | 3325.0 | Female |
| species | island | bill_length_mm | bill_depth_mm | flipper_length_mm | body_mass_g | sex | |
|---|---|---|---|---|---|---|---|
| 0 | Adelie | Torgersen | 39.1 | 18.7 | 181.0 | 3750.0 | Male |
| 1 | Adelie | Torgersen | 39.5 | 17.4 | 186.0 | 3800.0 | Female |
| 2 | Adelie | Torgersen | 40.3 | 18.0 | 195.0 | 3250.0 | Female |
| 4 | Adelie | Torgersen | 36.7 | 19.3 | 193.0 | 3450.0 | Female |
| 5 | Adelie | Torgersen | 39.3 | 20.6 | 190.0 | 3650.0 | Male |
| species | island | bill_length_mm | bill_depth_mm | flipper_length_mm | body_mass_g | sex | |
|---|---|---|---|---|---|---|---|
| 152 | Chinstrap | Dream | 46.5 | 17.9 | 192.0 | 3500.0 | Female |
| 153 | Chinstrap | Dream | 50.0 | 19.5 | 196.0 | 3900.0 | Male |
| 154 | Chinstrap | Dream | 51.3 | 19.2 | 193.0 | 3650.0 | Male |
| 155 | Chinstrap | Dream | 45.4 | 18.7 | 188.0 | 3525.0 | Female |
| 156 | Chinstrap | Dream | 52.7 | 19.8 | 197.0 | 3725.0 | Male |
| species | island | bill_length_mm | bill_depth_mm | flipper_length_mm | body_mass_g | sex | |
|---|---|---|---|---|---|---|---|
| 220 | Gentoo | Biscoe | 46.1 | 13.2 | 211.0 | 4500.0 | Female |
| 221 | Gentoo | Biscoe | 50.0 | 16.3 | 230.0 | 5700.0 | Male |
| 222 | Gentoo | Biscoe | 48.7 | 14.1 | 210.0 | 4450.0 | Female |
| 223 | Gentoo | Biscoe | 50.0 | 15.2 | 218.0 | 5700.0 | Male |
| 224 | Gentoo | Biscoe | 47.6 | 14.5 | 215.0 | 5400.0 | Male |
penguins.groupby(['species', 'island']).mean()
| bill_length_mm | bill_depth_mm | flipper_length_mm | body_mass_g | ||
|---|---|---|---|---|---|
| species | island | ||||
| Adelie | Biscoe | 38.975000 | 18.370455 | 188.795455 | 3709.659091 |
| Dream | 38.520000 | 18.240000 | 189.927273 | 3701.363636 | |
| Torgersen | 39.038298 | 18.451064 | 191.531915 | 3708.510638 | |
| Chinstrap | Dream | 48.833824 | 18.420588 | 195.823529 | 3733.088235 |
| Gentoo | Biscoe | 47.568067 | 14.996639 | 217.235294 | 5092.436975 |
groupby method creates an index based on the specified columns.MultiIndex.MultiIndex, use reset_index or set as_index=False in groupby.weird = penguins.groupby(['species', 'island']).mean()
weird
| bill_length_mm | bill_depth_mm | flipper_length_mm | body_mass_g | ||
|---|---|---|---|---|---|
| species | island | ||||
| Adelie | Biscoe | 38.975000 | 18.370455 | 188.795455 | 3709.659091 |
| Dream | 38.520000 | 18.240000 | 189.927273 | 3701.363636 | |
| Torgersen | 39.038298 | 18.451064 | 191.531915 | 3708.510638 | |
| Chinstrap | Dream | 48.833824 | 18.420588 | 195.823529 | 3733.088235 |
| Gentoo | Biscoe | 47.568067 | 14.996639 | 217.235294 | 5092.436975 |
weird['body_mass_g']
species    island
Adelie     Biscoe       3709.659091
           Dream        3701.363636
           Torgersen    3708.510638
Chinstrap  Dream        3733.088235
Gentoo     Biscoe       5092.436975
Name: body_mass_g, dtype: float64
weird.loc['Adelie']
| bill_length_mm | bill_depth_mm | flipper_length_mm | body_mass_g | |
|---|---|---|---|---|
| island | ||||
| Biscoe | 38.975000 | 18.370455 | 188.795455 | 3709.659091 |
| Dream | 38.520000 | 18.240000 | 189.927273 | 3701.363636 |
| Torgersen | 39.038298 | 18.451064 | 191.531915 | 3708.510638 |
weird.loc[('Adelie', 'Torgersen')]
bill_length_mm         39.038298
bill_depth_mm          18.451064
flipper_length_mm     191.531915
body_mass_g          3708.510638
Name: (Adelie, Torgersen), dtype: float64
weird.reset_index()
| species | island | bill_length_mm | bill_depth_mm | flipper_length_mm | body_mass_g | |
|---|---|---|---|---|---|---|
| 0 | Adelie | Biscoe | 38.975000 | 18.370455 | 188.795455 | 3709.659091 |
| 1 | Adelie | Dream | 38.520000 | 18.240000 | 189.927273 | 3701.363636 |
| 2 | Adelie | Torgersen | 39.038298 | 18.451064 | 191.531915 | 3708.510638 |
| 3 | Chinstrap | Dream | 48.833824 | 18.420588 | 195.823529 | 3733.088235 |
| 4 | Gentoo | Biscoe | 47.568067 | 14.996639 | 217.235294 | 5092.436975 |
penguins.groupby(['species', 'island'], as_index=False).mean()
| species | island | bill_length_mm | bill_depth_mm | flipper_length_mm | body_mass_g | |
|---|---|---|---|---|---|---|
| 0 | Adelie | Biscoe | 38.975000 | 18.370455 | 188.795455 | 3709.659091 |
| 1 | Adelie | Dream | 38.520000 | 18.240000 | 189.927273 | 3701.363636 |
| 2 | Adelie | Torgersen | 39.038298 | 18.451064 | 191.531915 | 3708.510638 |
| 3 | Chinstrap | Dream | 48.833824 | 18.420588 | 195.823529 | 3733.088235 |
| 4 | Gentoo | Biscoe | 47.568067 | 14.996639 | 217.235294 | 5092.436975 |
To find the above information, we can group by both 'species' and 'island'.
penguins.groupby(['species', 'island'])['body_mass_g'].mean()
species    island
Adelie     Biscoe       3709.659091
           Dream        3701.363636
           Torgersen    3708.510638
Chinstrap  Dream        3733.088235
Gentoo     Biscoe       5092.436975
Name: body_mass_g, dtype: float64
But we can also create a pivot table.
penguins.pivot_table(index='species',
                     columns='island',
                     values='body_mass_g',
                     aggfunc='mean')
| island | Biscoe | Dream | Torgersen |
|---|---|---|---|
| species | |||
| Adelie | 3709.659091 | 3701.363636 | 3708.510638 |
| Chinstrap | NaN | 3733.088235 | NaN |
| Gentoo | 5092.436975 | NaN | NaN |
Note that the DataFrame above shows the same information as the Series above it, just in a different arrangement.
pivot_table¶pivot_table DataFrame method aggregates a DataFrame using two columns. To use it:df.pivot_table(index=index_col,
columns=columns_col,
values=values_col,
aggfunc=func)
index_col.columns_col.func on values in values_col.Find the number of penguins per island and species.
penguins.pivot_table(index='island',
                     columns='species',
                     values='bill_length_mm',
                     aggfunc='count')
| species | Adelie | Chinstrap | Gentoo |
|---|---|---|---|
| island | |||
| Biscoe | 44.0 | NaN | 119.0 |
| Dream | 55.0 | 68.0 | NaN |
| Torgersen | 47.0 | NaN | NaN |
Note that there is a NaN at the intersection of 'Biscoe' and 'Chinstrap', because there were no Chinstrap penguins on Biscoe Island.
We can either use the fillna method afterwards or the fill_values argument to fill in NaNs.
penguins.pivot_table(index='island',
                     columns='species',
                     values='bill_length_mm',
                     aggfunc='count').fillna(0)
| species | Adelie | Chinstrap | Gentoo |
|---|---|---|---|
| island | |||
| Biscoe | 44.0 | 0.0 | 119.0 |
| Dream | 55.0 | 68.0 | 0.0 |
| Torgersen | 47.0 | 0.0 | 0.0 |
penguins.pivot_table(index='island',
                     columns='species',
                     values='bill_length_mm',
                     aggfunc='count',
                     fill_value=0)
| species | Adelie | Chinstrap | Gentoo |
|---|---|---|---|
| island | |||
| Biscoe | 44 | 0 | 119 |
| Dream | 55 | 68 | 0 |
| Torgersen | 47 | 0 | 0 |
Find the mean body mass per species and sex.
penguins.pivot_table(index='species', columns='sex', values='body_mass_g', aggfunc='mean')
| sex | Female | Male |
|---|---|---|
| species | ||
| Adelie | 3368.835616 | 4043.493151 |
| Chinstrap | 3527.205882 | 3938.970588 |
| Gentoo | 4679.741379 | 5484.836066 |
Important: In penguins, each row corresponds to an individual/observation. In the pivot table above, that is no longer true.
When using aggfunc='count', a pivot table describes the joint distribution of two categorical variables.
counts = penguins.pivot_table(index='species',
                              columns='sex',
                              values='body_mass_g',
                              aggfunc='count',
                              fill_value=0)

counts
| sex | Female | Male |
|---|---|---|
| species | ||
| Adelie | 73 | 73 |
| Chinstrap | 34 | 34 |
| Gentoo | 58 | 61 |
We can normalize the DataFrame by dividing by the total number of penguins. The resulting numbers can be interpreted as probabilities that a randomly selected penguin from the dataset belongs to a given combination of species and sex.
joint = counts / counts.sum().sum()
joint
| sex | Female | Male |
|---|---|---|
| species | ||
| Adelie | 0.219219 | 0.219219 |
| Chinstrap | 0.102102 | 0.102102 |
| Gentoo | 0.174174 | 0.183183 |
If we sum over one of the axes, we can compute marginal probabilities.
joint
| sex | Female | Male |
|---|---|---|
| species | ||
| Adelie | 0.219219 | 0.219219 |
| Chinstrap | 0.102102 | 0.102102 |
| Gentoo | 0.174174 | 0.183183 |
joint.sum(axis=1)
species
Adelie       0.438438
Chinstrap    0.204204
Gentoo       0.357357
dtype: float64
joint.sum(axis=0)
sex
Female    0.495495
Male      0.504505
dtype: float64
For instance, the first Series tells us that a randomly selected penguin has a 0.357357 chance of being of species 'Gentoo'.
If we divide counts by row or column sums, we can compute conditional probabilities.
counts
| sex | Female | Male |
|---|---|---|
| species | ||
| Adelie | 73 | 73 |
| Chinstrap | 34 | 34 |
| Gentoo | 58 | 61 |
counts.sum(axis=0)
sex
Female    165
Male      168
dtype: int64
The conditional distribution of species given sex is below.
counts / counts.sum(axis=0)
| sex | Female | Male |
|---|---|---|
| species | ||
| Adelie | 0.442424 | 0.434524 |
| Chinstrap | 0.206061 | 0.202381 |
| Gentoo | 0.351515 | 0.363095 |
For instance, the above DataFrame tells us that the probability that a randomly selected penguin is of species 'Adelie' given that they are of sex 'Female' is 0.442424.
The conditional distribution of sex given species is below.
counts.T / counts.sum(axis=1)
| species | Adelie | Chinstrap | Gentoo |
|---|---|---|---|
| sex | |||
| Female | 0.5 | 0.5 | 0.487395 |
| Male | 0.5 | 0.5 | 0.512605 |
pivot_table aggregates and reshapes¶pivot_table method does two things. It:moves = pd.DataFrame([
[1, 1, 'O'],
[2, 1, 'X'],
[2, 2, 'X'],
[2, 3, 'O'],
[3, 1, 'O'],
[3, 3, 'X']
], columns=['i', 'j', 'move'])
moves
| i | j | move | |
|---|---|---|---|
| 0 | 1 | 1 | O |
| 1 | 2 | 1 | X |
| 2 | 2 | 2 | X |
| 3 | 2 | 3 | O |
| 4 | 3 | 1 | O |
| 5 | 3 | 3 | X |
moves.pivot(index='i', columns='j', values='move').fillna('')
| j | 1 | 2 | 3 |
|---|---|---|---|
| i | |||
| 1 | O | ||
| 2 | X | X | O |
| 3 | O | X |
The pivot method only reshapes a DataFrame. It does not change any of the values in it (i.e. aggfunc doesn't work with pivot).
pivot_table = groupby + pivot¶pivot_table is a shortcut for using groupby and then using pivot.(
penguins.groupby(['species', 'sex'])[['body_mass_g']]
.mean()
.reset_index()
.pivot(index='species', columns='sex', values='body_mass_g')
)
| sex | Female | Male |
|---|---|---|
| species | ||
| Adelie | 3368.835616 | 4043.493151 |
| Chinstrap | 3527.205882 | 3938.970588 |
| Gentoo | 4679.741379 | 5484.836066 |
penguins.pivot_table(index='species', columns='sex', values='body_mass_g', aggfunc='mean')
| sex | Female | Male |
|---|---|---|
| species | ||
| Adelie | 3368.835616 | 4043.493151 |
| Chinstrap | 3527.205882 | 3938.970588 |
| Gentoo | 4679.741379 | 5484.836066 |
aggfunc='mean' plays the same role that .mean() does.
pivot_table and pivot reshape DataFrames from "long" to "wide".melt: un-pivots a DataFrame.stack: pivots multi-level columns to multi-indices.unstack: pivots multi-indices to columns.
Note: The number of "grade points" you earn for a course is
$$\text{number of units} \cdot \text{grade (out of 4)}$$So an A- in a 4 unit course earns $3.7 \cdot 4 = 14.8$ grade points.
lisa = pd.DataFrame([
        [20, 46],
        [18, 54],
        [5, 20]
    ],
    columns=['Units', 'Grade Points Earned'],
    index=['Fall', 'Winter', 'Spring'])

lisa
| Units | Grade Points Earned | |
|---|---|---|
| Fall | 20 | 46 |
| Winter | 18 | 54 |
| Spring | 5 | 20 |
bart = pd.DataFrame([
        [5, 10],
        [5, 13.5],
        [22, 81.4]
    ],
    columns=['Units', 'Grade Points Earned'],
    index=['Fall', 'Winter', 'Spring'])

bart
| Units | Grade Points Earned | |
|---|---|---|
| Fall | 5 | 10.0 |
| Winter | 5 | 13.5 |
| Spring | 22 | 81.4 |
The following DataFrame shows that Lisa had a higher GPA in all three quarters.
quarterly_gpas = pd.DataFrame(
    {
        "Lisa's Quarter GPA": lisa['Grade Points Earned'] / lisa['Units'],
        "Bart's Quarter GPA": bart['Grade Points Earned'] / bart['Units']
    }
)

quarterly_gpas
| Lisa's Quarter GPA | Bart's Quarter GPA | |
|---|---|---|
| Fall | 2.3 | 2.0 |
| Winter | 3.0 | 2.7 |
| Spring | 4.0 | 3.7 |
But Lisa's overall GPA is less than Bart's overall GPA.
tot = lisa.sum()
tot['Grade Points Earned'] / tot['Units']
2.7906976744186047
tot = bart.sum()
tot['Grade Points Earned'] / tot['Units']
3.278125
quarterly_gpas.assign(Lisa_units=lisa['Units']) \
              .assign(Bart_units=bart['Units']) \
              .iloc[:, [0, 2, 1, 3]]
| Lisa's Quarter GPA | Lisa_units | Bart's Quarter GPA | Bart_units | |
|---|---|---|---|---|
| Fall | 2.3 | 20 | 2.0 | 5 |
| Winter | 3.0 | 18 | 2.7 | 5 |
| Spring | 4.0 | 5 | 3.7 | 22 |
Simpson's paradox occurs when grouped data and ungrouped data show opposing trends.
It is purely arithmetic – it is a consequence of weighted averages.
It often happens because there is a hidden factor (i.e. a confounder) within the data that influences results.
Question: What is the "correct" way to summarize your data? What if you had to act on these results?
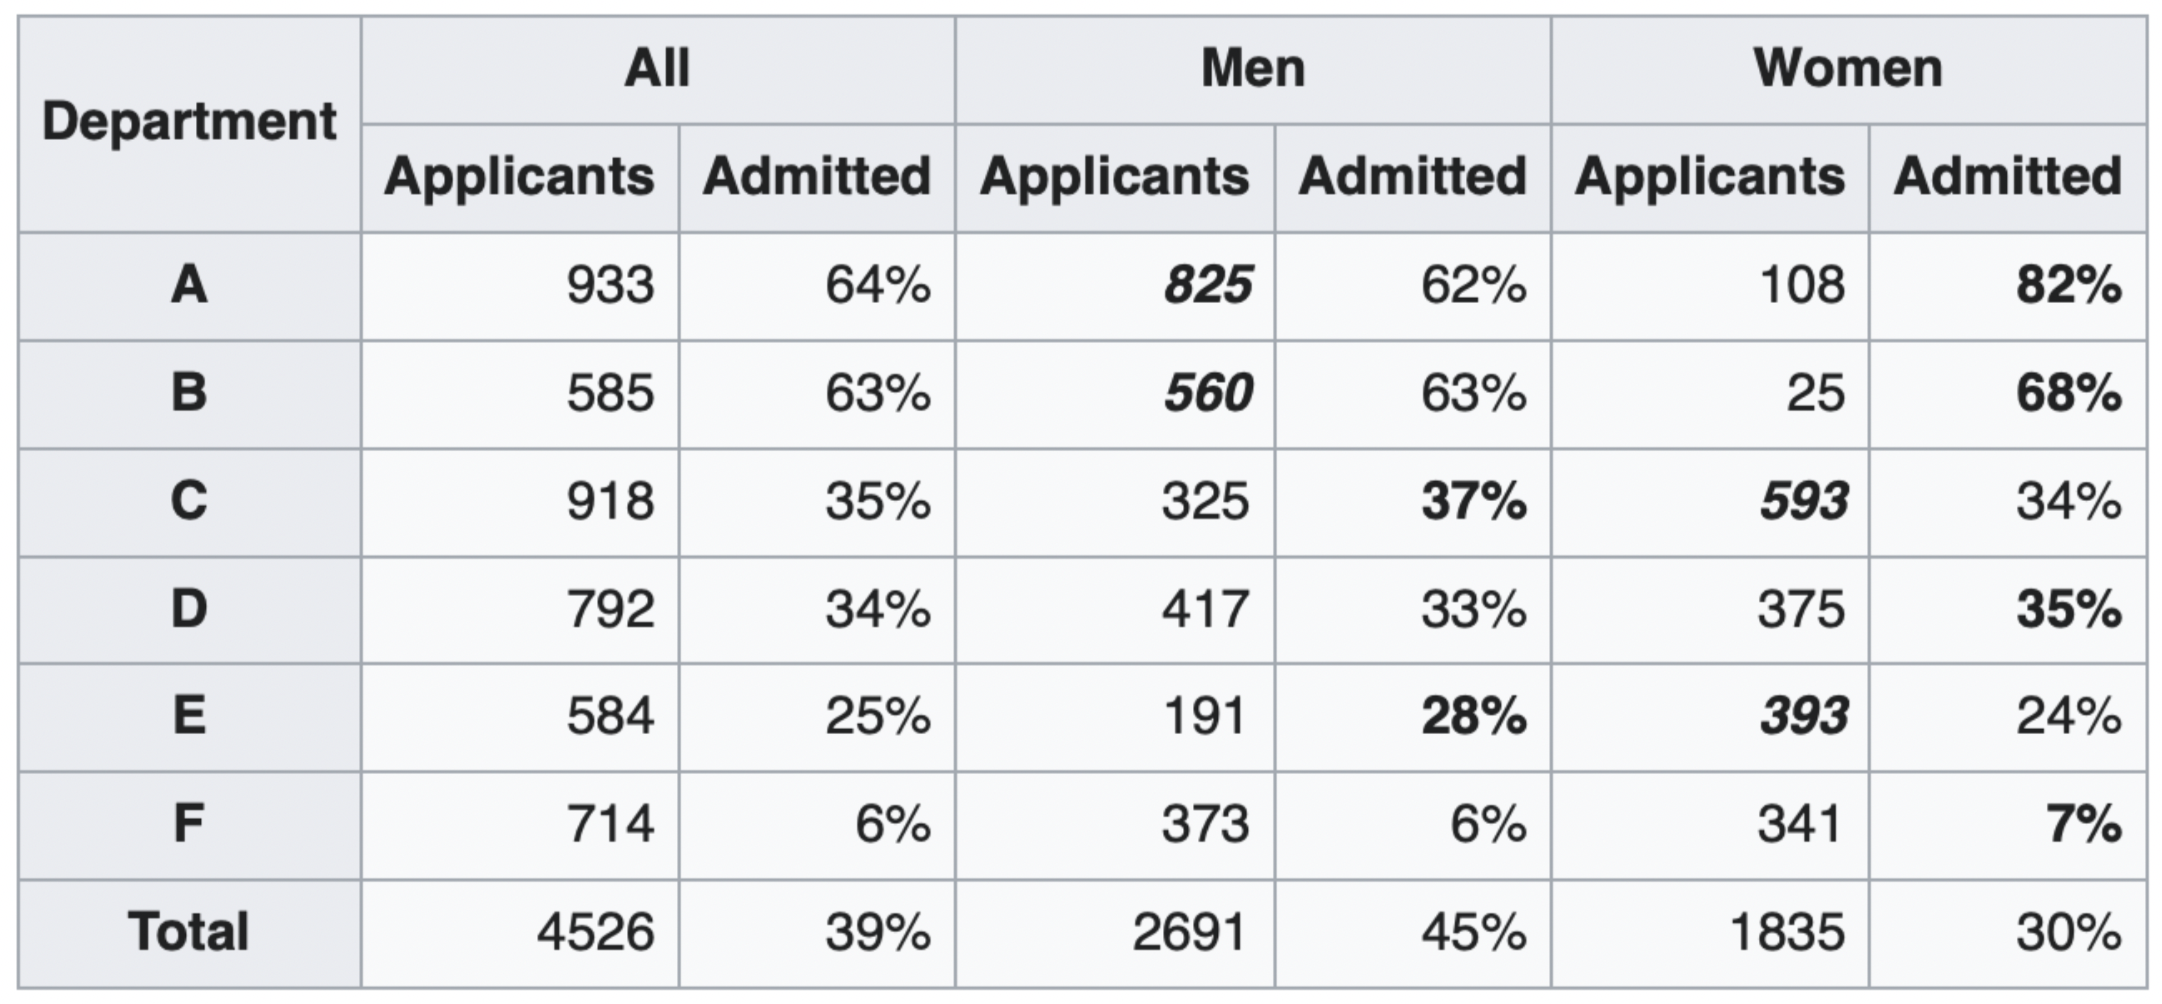
show_paradox_slides()
This doesn't mean that admissions are free from gender discrimination!
From Moss-Racusin et al., 2012, PNAS (cited 2600+ times):
In a randomized double-blind study (n = 127), science faculty from research-intensive universities rated the application materials of a student—who was randomly assigned either a male or female name—for a laboratory manager position. Faculty participants rated the male applicant as significantly more competent and hireable than the (identical) female applicant. These participants also selected a higher starting salary and offered more career mentoring to the male applicant. The gender of the faculty participants did not affect responses, such that female and male faculty were equally likely to exhibit bias against the female student.
From Williams and Ceci, 2015, PNAS:
Here we report five hiring experiments in which faculty evaluated hypothetical female and male applicants, using systematically varied profiles disguising identical scholarship, for assistant professorships in biology, engineering, economics, and psychology. Contrary to prevailing assumptions, men and women faculty members from all four fields preferred female applicants 2:1 over identically qualified males with matching lifestyles (single, married, divorced), with the exception of male economists, who showed no gender preference.
Not necessarily. One explanation, from William and Ceci:
Instead, past studies have used ratings of students’ hirability for a range of posts that do not include tenure-track jobs, such as managing laboratories or performing math assignments for a company. However, hiring tenure-track faculty differs from hiring lower-level staff: it entails selecting among highly accomplished candidates, all of whom have completed Ph.D.s and amassed publications and strong letters of support. Hiring bias may occur when applicants’ records are ambiguous, as was true in studies of hiring bias for lower-level staff posts, but such bias may not occur when records are clearly strong, as is the case with tenure-track hiring.
From Witteman, et al, 2019, in The Lancet:
Thus, evidence of scientists favouring women comes exclusively from hypothetical scenarios, whereas evidence of scientists favouring men comes from hypothetical scenarios and real behaviour. This might reflect academics' growing awareness of the social desirability of achieving gender balance, while real academic behaviour might not yet put such ideals into action.
| Phone Type | Stars for Dirty Birds | Stars for The Loft |
|---|---|---|
| Android | 4.24 | 4.0 |
| iPhone | 2.99 | 2.79 |
| All | 3.32 | 3.37 |
ratings = pd.read_csv('data/ratings.csv')
ratings.sample(5).head()
| phone | restaurant | rating | |
|---|---|---|---|
| 4200 | iPhone | The Loft | 2 |
| 2592 | iPhone | Dirty Birds | 3 |
| 2658 | iPhone | Dirty Birds | 3 |
| 4414 | iPhone | The Loft | 3 |
| 2516 | iPhone | Dirty Birds | 3 |
Aggregated means:
ratings.pivot_table(index='phone', columns='restaurant', values='rating', aggfunc='mean')
| restaurant | Dirty Birds | The Loft |
|---|---|---|
| phone | ||
| Android | 4.235669 | 4.000000 |
| iPhone | 2.987957 | 2.787971 |
Disaggregated means:
ratings.groupby('restaurant').mean()
| rating | |
|---|---|
| restaurant | |
| Dirty Birds | 3.320652 |
| The Loft | 3.366205 |
Be skeptical of...
For the rest of this week, we will look at how to combine multiple DataFrames.
Question: How do we combine multiple datasets?
pd.concat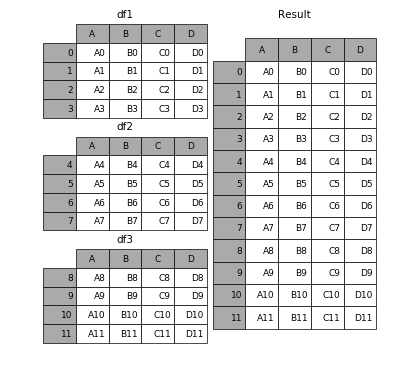
pd.concat function combines DataFrame and Series objects.pd.concat has many options; we'll learn them slowly.By default, pd.concat stacks DataFrames row-wise, i.e. on top of one another.
section_A = pd.DataFrame({
    'Name': ['Annie', 'Billy', 'Sally', 'Tommy'],
    'Midterm': [98, 82, 23, 45],
    'Final': [88, 100, 99, 67]
})

section_A
| Name | Midterm | Final | |
|---|---|---|---|
| 0 | Annie | 98 | 88 |
| 1 | Billy | 82 | 100 |
| 2 | Sally | 23 | 99 |
| 3 | Tommy | 45 | 67 |
section_B = pd.DataFrame({
    'Name': ['Junior', 'Rex', 'Flash'],
    'Midterm': [70, 99, 81],
    'Final': [42, 25, 90]
})

section_B
| Name | Midterm | Final | |
|---|---|---|---|
| 0 | Junior | 70 | 42 |
| 1 | Rex | 99 | 25 |
| 2 | Flash | 81 | 90 |
Let's use pd.concat on a list of the above two DataFrames.
pd.concat([section_A, section_B])
| Name | Midterm | Final | |
|---|---|---|---|
| 0 | Annie | 98 | 88 |
| 1 | Billy | 82 | 100 |
| 2 | Sally | 23 | 99 |
| 3 | Tommy | 45 | 67 |
| 0 | Junior | 70 | 42 |
| 1 | Rex | 99 | 25 |
| 2 | Flash | 81 | 90 |
Setting the optional argument ignore_index to True fixes the index (which .reset_index() also could do).
pd.concat([section_A, section_B], ignore_index=True)
| Name | Midterm | Final | |
|---|---|---|---|
| 0 | Annie | 98 | 88 |
| 1 | Billy | 82 | 100 |
| 2 | Sally | 23 | 99 |
| 3 | Tommy | 45 | 67 |
| 4 | Junior | 70 | 42 |
| 5 | Rex | 99 | 25 |
| 6 | Flash | 81 | 90 |
To keep track of which original DataFrame each row came from, we can use the keys optional argument.
combined = pd.concat([section_A, section_B], keys=['Section A', 'Section B'])
combined
| Name | Midterm | Final | ||
|---|---|---|---|---|
| Section A | 0 | Annie | 98 | 88 |
| 1 | Billy | 82 | 100 | |
| 2 | Sally | 23 | 99 | |
| 3 | Tommy | 45 | 67 | |
| Section B | 0 | Junior | 70 | 42 |
| 1 | Rex | 99 | 25 | |
| 2 | Flash | 81 | 90 |
The resulting DataFrame has a MultiIndex, though.
combined.loc['Section A']
| Name | Midterm | Final | |
|---|---|---|---|
| 0 | Annie | 98 | 88 |
| 1 | Billy | 82 | 100 |
| 2 | Sally | 23 | 99 |
| 3 | Tommy | 45 | 67 |
If we concatenate two DataFrames that don't share the same column names, NaNs are added in the columns that aren't shared.
section_C = pd.DataFrame({
    'Name': ['Justin', 'Marina'],
    'Final': [98, 52]
})

section_C
| Name | Final | |
|---|---|---|
| 0 | Justin | 98 |
| 1 | Marina | 52 |
section_D = pd.DataFrame({
    'Name': ['Janine', 'Aaron', 'Suraj'],
    'Midterm': [10, 80, 40]
})

section_D
| Name | Midterm | |
|---|---|---|
| 0 | Janine | 10 |
| 1 | Aaron | 80 |
| 2 | Suraj | 40 |
pd.concat([section_C, section_D])
| Name | Final | Midterm | |
|---|---|---|---|
| 0 | Justin | 98.0 | NaN |
| 1 | Marina | 52.0 | NaN |
| 0 | Janine | NaN | 10.0 |
| 1 | Aaron | NaN | 80.0 |
| 2 | Suraj | NaN | 40.0 |
pd.concat returns a copy; it does not modify any of the input DataFrames.pd.concat in a loop, as it has terrible time and space efficiency.total = pd.DataFrame()
for df in dataframes:
total = total.concat(df)
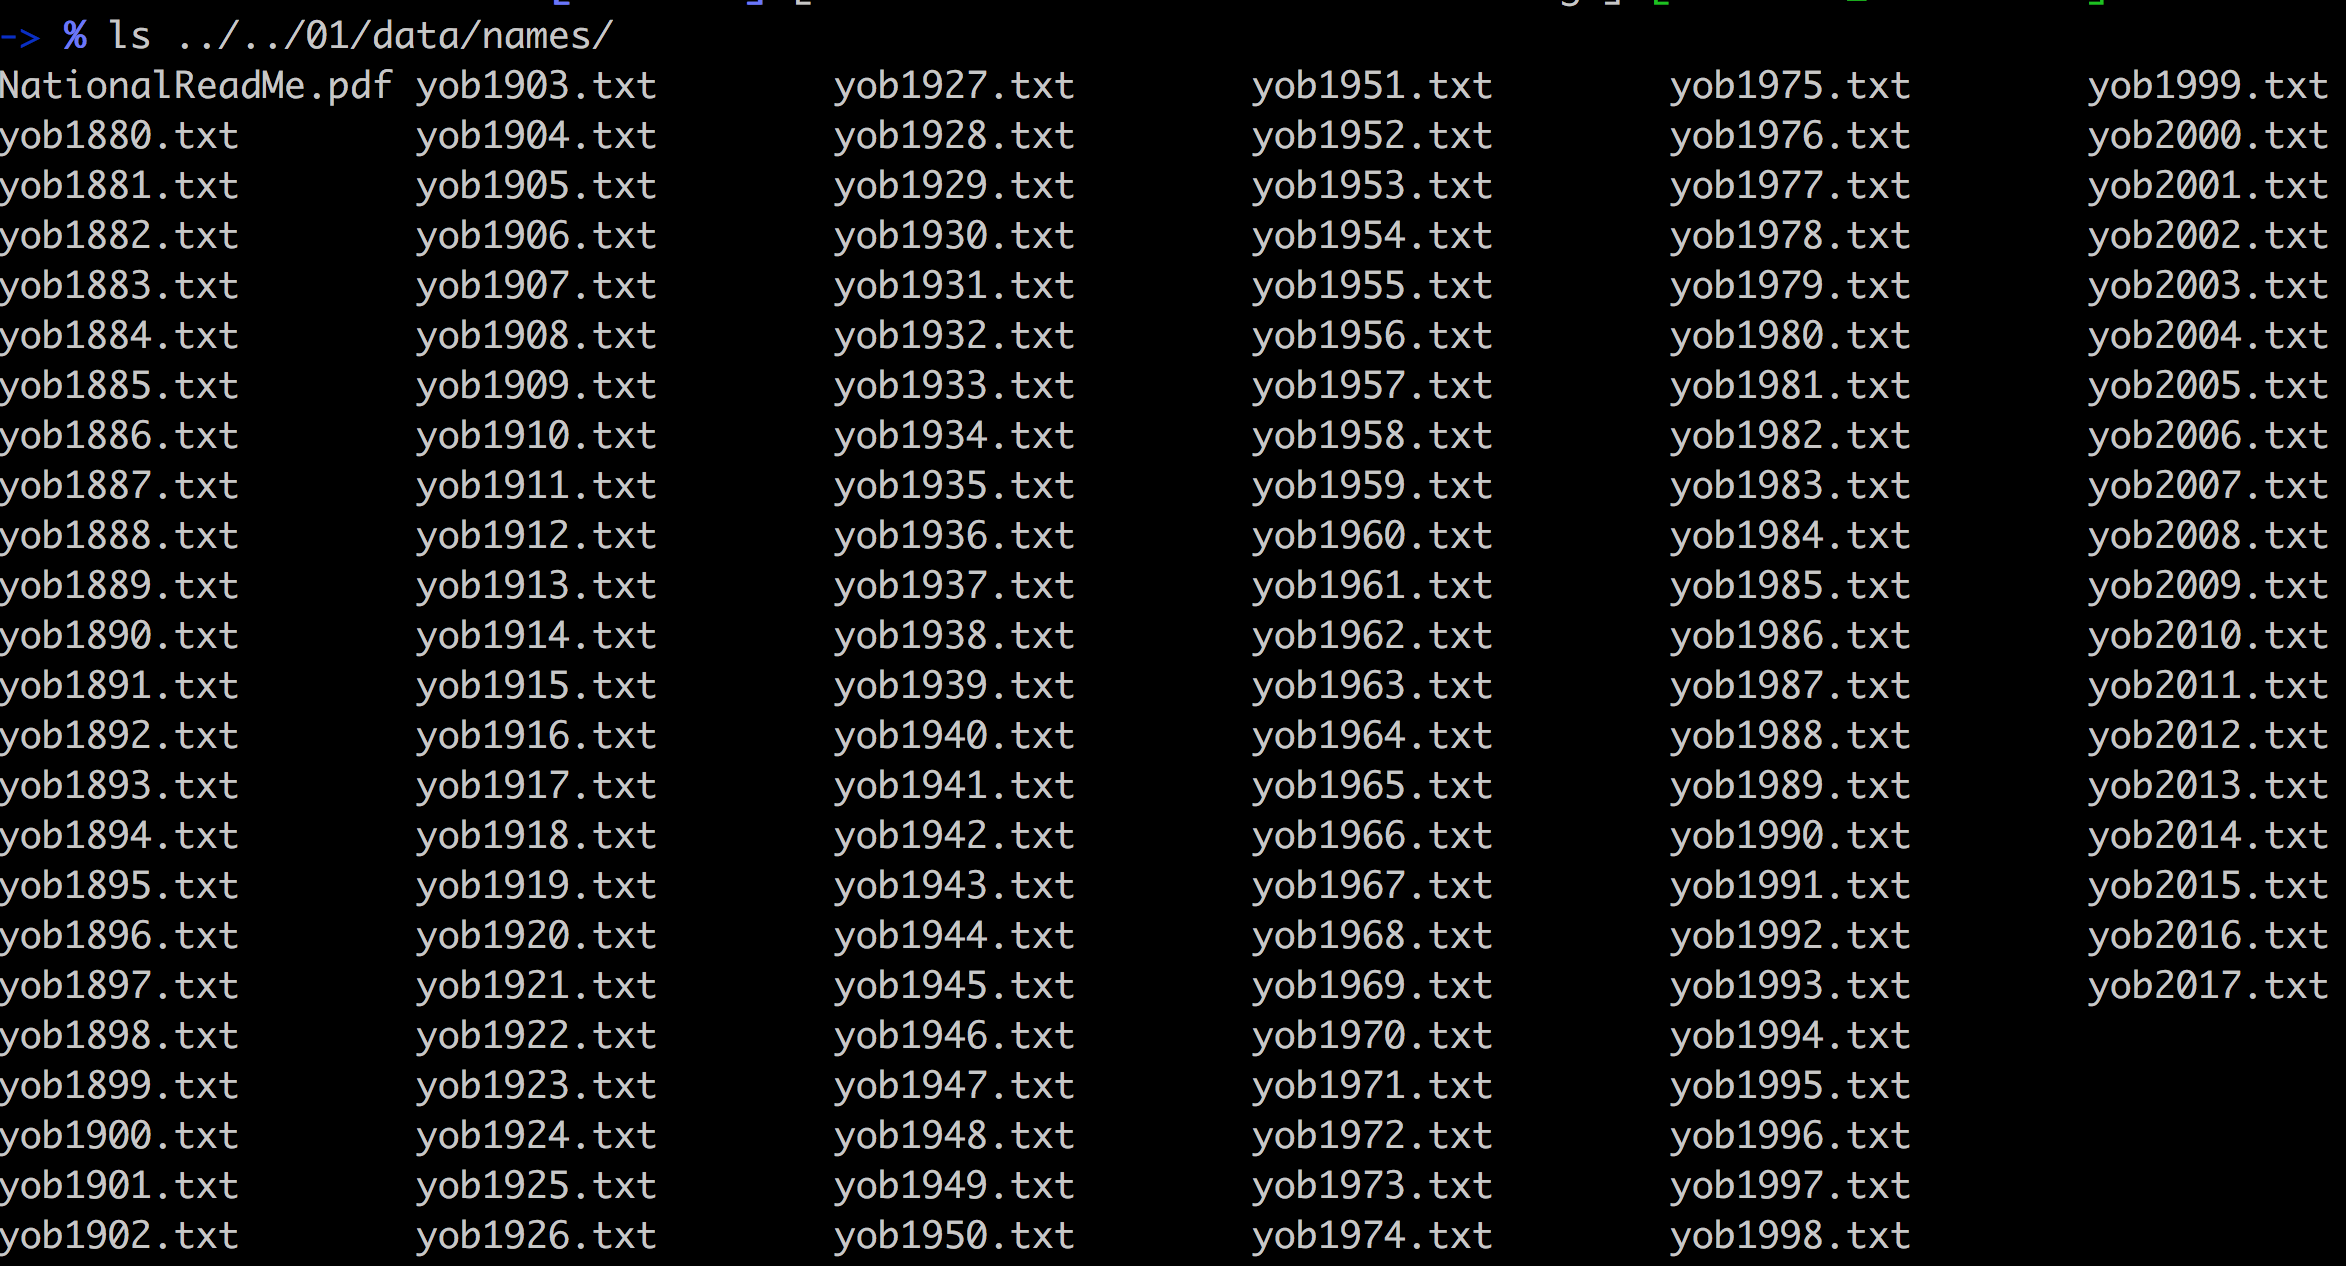
pd.concat(dataframes), where dataframes is a list of DataFrames.os.listdir(dirname) returns a list of the names of the files in the folder dirname.os.listdir('data')
['.DS_Store', 'ratings.csv']
os.listdir('../')
['.DS_Store',
 'lec01',
 'lec06',
 'lec08',
 'lec07',
 '.ipynb_checkpoints',
 'lec05',
 'lec02',
 'lec03',
 'lec04']
The following does something similar.
!ls ../
lec01 lec02 lec03 lec04 lec05 lec06 lec07 lec08
.csv file per day for 1 year.pd.concat the DataFrames together.pandas.When working with time data, you will see two different kinds of "times":
datetime module¶Python has an in-built datetime module, which contains datetime and timedelta types. These are much more convenient to deal with than strings that contain times.
import datetime
datetime.datetime.now()
datetime.datetime(2022, 4, 13, 11, 3, 59, 289345)
datetime.datetime.now() + datetime.timedelta(days=3, hours=5)
datetime.datetime(2022, 4, 16, 16, 3, 59, 294369)
Recall, Unix timestamps count the number of seconds since January 1st, 1970.
datetime.datetime.now().timestamp()
1649873039.298737
pandas¶pd.Timestamp is the pandas equivalent of datetime.pd.to_datetime converts strings to pd.Timestamp objects.pd.Timestamp(year=1998, month=11, day=26)
Timestamp('1998-11-26 00:00:00')
final_start = pd.to_datetime('June 4th, 2022, 11:30AM')
final_start
Timestamp('2022-06-04 11:30:00')
final_finish = pd.to_datetime('June 4th, 2022, 2:30PM')
final_finish
Timestamp('2022-06-04 14:30:00')
Timestamps have time-related attributes, e.g. dayofweek, hour, min, sec.
final_finish.dayofweek
5
final_finish.year
2022
Subtracting timestamps yields pd.Timedelta objects.
final_finish - final_start
Timedelta('0 days 03:00:00')
pd.to_datetime, pandas stores them as yet another type:
np.datetime64.pd.Timestamp, but optimized for memory and speed efficiency.pd.Timestamp back.times = pd.DataFrame({'finish': pd.to_datetime(['Sun, Jan 01, 1989',
'2022-04-13T11:00',
'1/1/1970'])})
times
| finish | |
|---|---|
| 0 | 1989-01-01 00:00:00 |
| 1 | 2022-04-13 11:00:00 |
| 2 | 1970-01-01 00:00:00 |
times.info()
<class 'pandas.core.frame.DataFrame'>
RangeIndex: 3 entries, 0 to 2
Data columns (total 1 columns):
 #   Column  Non-Null Count  Dtype
---  ------  --------------  -----
 0   finish  3 non-null      datetime64[ns]
dtypes: datetime64[ns](1)
memory usage: 152.0 bytes
times.iloc[0, 0]
Timestamp('1989-01-01 00:00:00')
times.sort_values('finish')
| finish | |
|---|---|
| 2 | 1970-01-01 00:00:00 |
| 0 | 1989-01-01 00:00:00 |
| 1 | 2022-04-13 11:00:00 |
Below, we have the Final Exam starting and ending times for two sections of a course.
times_A = pd.DataFrame({
    'Name': ['Annie', 'Billy', 'Sally', 'Tommy'],
    'start_exam': ['15:00', '15:02', '15:01', '15:00'],
    'finish_exam': ['16:00', '17:58', '17:05', '16:55']
})

times_B = pd.DataFrame({
    'Name': ['Junior', 'Rex', 'Flash'],
    'start_exam': ['18:00', '18:06', '19:07'],
    'finish_exam': ['20:00', '20:50', '20:59']
})

display(times_A)
display(times_B)
| Name | start_exam | finish_exam | |
|---|---|---|---|
| 0 | Annie | 15:00 | 16:00 |
| 1 | Billy | 15:02 | 17:58 |
| 2 | Sally | 15:01 | 17:05 |
| 3 | Tommy | 15:00 | 16:55 |
| Name | start_exam | finish_exam | |
|---|---|---|---|
| 0 | Junior | 18:00 | 20:00 |
| 1 | Rex | 18:06 | 20:50 |
| 2 | Flash | 19:07 | 20:59 |
Question: Who finished the exam the fastest amongst all students in the course?
Approach:
pd.Timestamp.'finish_exam' and 'start_exam'.# Step 1
both_versions = pd.concat([times_A, times_B])
both_versions
| Name | start_exam | finish_exam | |
|---|---|---|---|
| 0 | Annie | 15:00 | 16:00 |
| 1 | Billy | 15:02 | 17:58 |
| 2 | Sally | 15:01 | 17:05 |
| 3 | Tommy | 15:00 | 16:55 |
| 0 | Junior | 18:00 | 20:00 |
| 1 | Rex | 18:06 | 20:50 |
| 2 | Flash | 19:07 | 20:59 |
# Step 2
both_versions = both_versions.assign(
    start_exam=pd.to_datetime(both_versions['start_exam']),
    finish_exam=pd.to_datetime(both_versions['finish_exam'])
)

both_versions.info()
<class 'pandas.core.frame.DataFrame'>
Int64Index: 7 entries, 0 to 2
Data columns (total 3 columns):
 #   Column       Non-Null Count  Dtype
---  ------       --------------  -----
 0   Name         7 non-null      object
 1   start_exam   7 non-null      datetime64[ns]
 2   finish_exam  7 non-null      datetime64[ns]
dtypes: datetime64[ns](2), object(1)
memory usage: 224.0+ bytes
# Step 3
both_versions = both_versions.assign(
    elapsed=both_versions['finish_exam'] - both_versions['start_exam']
)

both_versions
| Name | start_exam | finish_exam | elapsed | |
|---|---|---|---|---|
| 0 | Annie | 2022-04-13 15:00:00 | 2022-04-13 16:00:00 | 0 days 01:00:00 |
| 1 | Billy | 2022-04-13 15:02:00 | 2022-04-13 17:58:00 | 0 days 02:56:00 |
| 2 | Sally | 2022-04-13 15:01:00 | 2022-04-13 17:05:00 | 0 days 02:04:00 |
| 3 | Tommy | 2022-04-13 15:00:00 | 2022-04-13 16:55:00 | 0 days 01:55:00 |
| 0 | Junior | 2022-04-13 18:00:00 | 2022-04-13 20:00:00 | 0 days 02:00:00 |
| 1 | Rex | 2022-04-13 18:06:00 | 2022-04-13 20:50:00 | 0 days 02:44:00 |
| 2 | Flash | 2022-04-13 19:07:00 | 2022-04-13 20:59:00 | 0 days 01:52:00 |
# Steps 4 and 5
both_versions.sort_values('elapsed').iloc[0].loc['Name']
'Annie'
pivot_table aggregates data based on two categorical columns, and reshapes the result to be "wide" instead of "long".pd.concat with a list of DataFrames.pandas are stored using pd.Timestamp and pd.Timedelta objects.