import numpy as np
import pandas as pd
import os
import matplotlib.pyplot as plt
plt.style.use('seaborn-white')
plt.rc('figure', dpi=100, figsize=(10, 5))
plt.rc('font', size=12)
baby_fp = os.path.join('data', 'baby.csv')
baby = pd.read_csv(baby_fp)
smoking_and_birthweight = baby[['Maternal Smoker', 'Birth Weight']]
smoking_and_birthweight.head()
Maternal Smoker | Birth Weight | |
---|---|---|
0 | False | 120 |
1 | False | 113 |
2 | True | 128 |
3 | True | 108 |
4 | False | 136 |
Recall our permutation test from last class:
We'll use 3000 repetitions instead of 500.
%%time
n_repetitions = 3000
differences = []
for _ in range(n_repetitions):
# Step 1: Shuffle the weights
shuffled_weights = (
smoking_and_birthweight['Birth Weight']
.sample(frac=1)
.reset_index(drop=True) # Be sure to reset the index! (Why?)
)
# Step 2: Put them in a DataFrame
shuffled = (
smoking_and_birthweight
.assign(**{'Shuffled Birth Weight': shuffled_weights})
)
# Step 3: Compute the test statistic
group_means = (
shuffled
.groupby('Maternal Smoker')
.mean()
.loc[:, 'Shuffled Birth Weight']
)
difference = group_means.diff().iloc[-1]
# Step 4: Store the result
differences.append(difference)
differences[:10]
CPU times: user 2.34 s, sys: 17.4 ms, total: 2.36 s Wall time: 2.36 s
[1.9127656657068428, -1.2674101497630943, 0.031131831131830268, -0.8953760836113815, 0.9969895028718554, -0.2657799716623117, -0.015372427137137379, -0.08334018922255382, -0.31228422993129357, -1.6895257248198448]
Improvement 1: Use np.random.permutation
instead of df.sample
.
Why? This way, we don't need to shuffle index as well. This is how you ran permutation tests in DSC 10.
to_shuffle = smoking_and_birthweight.copy()
weights = to_shuffle['Birth Weight']
%%timeit
np.random.permutation(weights.values)
20 µs ± 161 ns per loop (mean ± std. dev. of 7 runs, 10000 loops each)
%%timeit
weights.sample(frac=1)
56.6 µs ± 401 ns per loop (mean ± std. dev. of 7 runs, 10000 loops each)
Improvement 2: Don't use assign
; instead, add the new column in-place.
Why? This way, we don't create a new copy of our DataFrame on each iteration.
%%timeit
to_shuffle['Shuffled Birth Weight'] = np.random.permutation(weights.values)
35.3 µs ± 49.7 ns per loop (mean ± std. dev. of 7 runs, 10000 loops each)
%%timeit
to_shuffle.assign(**{'Shuffled Birth Weight': np.random.permutation(weights.values)})
117 µs ± 3.05 µs per loop (mean ± std. dev. of 7 runs, 10000 loops each)
Let's try out both of these improvements, again with 3000 repetitions.
%%time
n_repetitions = 3000
faster_differences = []
to_shuffle = smoking_and_birthweight.copy()
weights = to_shuffle['Birth Weight'].values
for _ in range(n_repetitions):
# Step 1: Shuffle the weights
shuffled_weights = np.random.permutation(weights)
# Step 2: Put them in a DataFrame
to_shuffle['Shuffled Birth Weight'] = shuffled_weights
# Step 3: Compute the test statistic
group_means = (
to_shuffle
.groupby('Maternal Smoker')
.mean()
.loc[:, 'Shuffled Birth Weight']
)
difference = group_means.diff().iloc[-1]
# Step 4: Store the result
faster_differences.append(difference)
faster_differences[:10]
CPU times: user 1.75 s, sys: 3.85 ms, total: 1.75 s Wall time: 1.75 s
[0.44967015555249645, -0.2049667108490496, 0.1205630970336955, -1.7718024894495414, -0.9347258406081949, 0.14560385148621435, 1.0578027636851175, -0.4196017490135233, 1.5407315995551158, 0.38885689473924856]
bins = np.linspace(-4, 4, 20)
plt.hist(differences, density=True, ec='w', bins=bins, alpha=0.65, label='Original Test Statistics');
plt.hist(faster_differences, density=True, ec='w', bins=bins, alpha=0.65, label='Faster Test Statistics')
plt.legend();
The distribution of test statistics generated by the faster approach resembles the distribution of test statistics generated by the original approach. Both are doing the same thing!
groupby
inside of a loop.groupby
entirely!(3000, 1174)
.'Maternal Smoker'
(bool
) column.is_smoker = smoking_and_birthweight['Maternal Smoker'].values
weights = smoking_and_birthweight['Birth Weight'].values
is_smoker
array([False, False, True, ..., True, False, False])
%%time
np.random.seed(24) # So that we get the same results each time (for lecture)
# We are still using a for-loop!
is_smoker_permutations = np.column_stack([
np.random.permutation(is_smoker)
for _ in range(3000)
]).T
CPU times: user 88 ms, sys: 3.51 ms, total: 91.5 ms Wall time: 90.4 ms
In is_smoker_permutatons
, each row is a new simulation.
False
means that baby comes from a non-smoking mother.True
means that baby comes from a smoking mother.is_smoker_permutations
array([[ True, True, False, ..., True, True, False], [ True, False, True, ..., True, False, False], [False, True, False, ..., True, False, True], ..., [False, False, True, ..., False, False, True], [ True, True, False, ..., True, False, True], [ True, True, True, ..., False, True, True]])
is_smoker_permutations.shape
(3000, 1174)
Note that each row has 459 True
s and 715 False
s – it's just the order of them that's different.
is_smoker_permutations.sum(axis=1)
array([459, 459, 459, ..., 459, 459, 459])
The first row of is_smoker_permutations
tells us that in this permutation, we'll assign baby 1 to "smoker", baby 2 to "smoker", baby 3 to "non-smoker", and so on.
is_smoker_permutations[0]
array([ True, True, False, ..., True, True, False])
is_smoker_permutations
by weights
, we will create a new (3000, 1174) array, in which:is_smoker_permutations
is a "mask".First, let's try this on just the first permutation (i.e. the first row of is_smoker_permutations
).
weights * is_smoker_permutations[0]
array([120, 113, 0, ..., 130, 125, 0])
Now, on all of is_smoker_permutations
:
weights * is_smoker_permutations
array([[120, 113, 0, ..., 130, 125, 0], [120, 0, 128, ..., 130, 0, 0], [ 0, 113, 0, ..., 130, 0, 117], ..., [ 0, 0, 128, ..., 0, 0, 117], [120, 113, 0, ..., 130, 0, 117], [120, 113, 128, ..., 0, 125, 117]])
The mean of the non-zero entries in a row is the mean of the weights of "smoker" babies in that permutation.
Why can't we use .mean(axis=1)
?
n_smokers = is_smoker.sum()
mean_smokers = (weights * is_smoker_permutations).sum(axis=1) / n_smokers
mean_smokers
array([118.94117647, 118.07625272, 120.38562092, ..., 119.76688453, 119.2745098 , 120.22222222])
mean_smokers.shape
(3000,)
We also need to get the weights of the non-smokers in our permutations. We can do this by "inverting" the is_smoker_permutations
mask and performing the same calculations.
n_non_smokers = 1174 - n_smokers
mean_non_smokers = (weights * ~is_smoker_permutations).sum(axis=1) / n_non_smokers
mean_non_smokers
array([119.7972028 , 120.35244755, 118.86993007, ..., 119.26713287, 119.58321678, 118.97482517])
test_statistics = mean_smokers - mean_non_smokers
test_statistics
array([-0.85602633, -2.27619483, 1.51569085, ..., 0.49975166, -0.30870698, 1.24739705])
%%time
is_smoker = smoking_and_birthweight['Maternal Smoker'].values
weights = smoking_and_birthweight['Birth Weight'].values
n_smokers = is_smoker.sum()
n_non_smokers = 1174 - n_smokers
is_smoker_permutations = np.column_stack([
np.random.permutation(is_smoker)
for _ in range(3000)
]).T
mean_smokers = (weights * is_smoker_permutations).sum(axis=1) / n_smokers
mean_non_smokers = (weights * ~is_smoker_permutations).sum(axis=1) / n_non_smokers
ultra_fast_differences = mean_smokers - mean_non_smokers
CPU times: user 96.5 ms, sys: 4.7 ms, total: 101 ms Wall time: 99.1 ms
plt.hist(differences, density=True, ec='w', bins=bins, alpha=0.65, label='Original Test Statistics');
plt.hist(ultra_fast_differences, density=True, ec='w', bins=bins, alpha=0.65, label='Ultra Fast Test Statistics')
plt.legend();
Again, the distribution of test statistics with the "ultra-fast" simulation is similar to the original distribution of test statistics.
_Good resources: course notes, Wikipedia, this textbook page_
The recorded data is supposed to "well-represent" the data generating process, and subsequently the true model.
Example: Consider the upcoming Midterm Exam.
pivot_table
, that would not give us an accurate picture of your understanding of DSC 80!We will focus on the second problem.
There are four key ways in which values can be missing. It is important to distinguish between these types so that we can correctly handle missing data (Lecture 13).
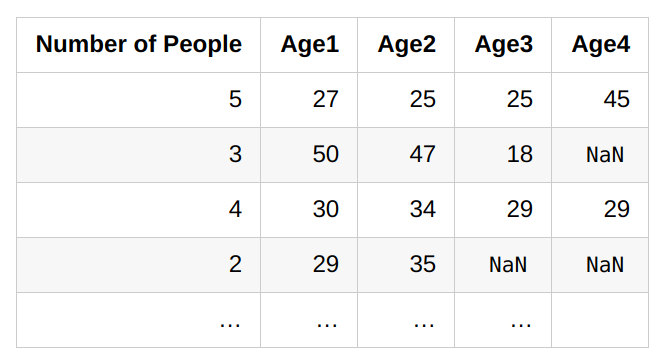
Values in a column are missing by design if:
If you can determine whether a value is missing solely using other columns, then the data is missing by design.
'Age4'
is missing if and only if 'Number of People'
is less than 4.Example: 'Car Type'
and 'Car Colour'
are missing if and only if 'Own a car?'
is 'No'
.
Not missing at random (NMAR).
Missing at random (MAR).
Missing completely at random (MCAR).
Consider the following (contrived) example:
We are now missing birth months for the first 10 people we surveyed. What is the missingness mechanism for birth months if:
Remember:
A good strategy is to assess missingness in the following order.
In each of the following examples, decide whether the missing data are MD, NMAR, MAR, or MCAR:
'gender'
and 'age'
. 'age'
has missing values.'self-reported education level'
, which contains missing values.'Version 1'
, 'Version 2'
, and 'Version 3'
. $\frac{2}{3}$ of the entries in the table are NaN
.Suppose we have:
Data is missing completely at random (MCAR) if
$$\text{P}(\text{data is present} \: | \: Y_{obs}, Y_{mis}, \psi) = \text{P}(\text{data is present} \: | \: \psi)$$That is, adding information about the dataset doesn't change the likelihood data is missing!
Suppose we have:
Data is missing at random (MCAR) if
$$\text{P}(\text{data is present} \: | \: Y_{obs}, Y_{mis}, \psi) = \text{P}(\text{data is present} \: | \: Y_{obs}, \psi)$$That is, MAR data is actually MCAR, conditional on $Y_{obs}$.
Suppose we have:
Data is not missing at random (NMAR) if
$$\text{P}(\text{data is present} \: | \: Y_{obs}, Y_{mis}, \psi)$$cannot be simplified. That is, in NMAR data, missingness is dependent on the missing value itself.
Phone | Screen Size | Price |
---|---|---|
iPhone 13 | 6.06 | 999 |
Galaxy Z Fold 3 | 7.6 | NaN |
OnePlus 9 Pro | 6.7 | 799 |
iPhone 12 Pro Max | 6.68 | NaN |
Missing completely at random (MCAR): The chance that a value is missing is completely independent of other columns and the actual missing value.
Next time: How to verify if data are MAR vs. MCAR using a permutation test. A new test statistic.
Important: Refer to the Flowchart when deciding between missingness types.