In [4]:
pd.plotting.scatter_matrix(heights.drop('gender', axis=1));

import numpy as np
import pandas as pd
import os

import matplotlib.pyplot as plt
plt.style.use('seaborn-white')
plt.rc('figure', dpi=100, figsize=(10, 5))
plt.rc('font', size=12)
Remember: today's lecture is in scope for the Midterm Exam!
A good strategy is to assess missingness in the following order.
In each of the following examples, decide whether the missing data are MD, NMAR, MAR, or MCAR:
'gender' and 'age'. 'age' has missing values.'self-reported education level', which contains missing values.'Version 1', 'Version 2', and 'Version 3'. $\frac{2}{3}$ of the entries in the table are NaN.Suppose we have:
Data is missing completely at random (MCAR) if
$$\text{P}(\text{data is present} \: | \: Y_{obs}, Y_{mis}, \psi) = \text{P}(\text{data is present} \: | \: \psi)$$That is, adding information about the dataset doesn't change the likelihood data is missing!
Suppose we have:
Data is missing at random (MCAR) if
$$\text{P}(\text{data is present} \: | \: Y_{obs}, Y_{mis}, \psi) = \text{P}(\text{data is present} \: | \: Y_{obs}, \psi)$$That is, MAR data is actually MCAR, conditional on $Y_{obs}$.
Suppose we have:
Data is not missing at random (NMAR) if
$$\text{P}(\text{data is present} \: | \: Y_{obs}, Y_{mis}, \psi)$$cannot be simplified. That is, in NMAR data, missingness is dependent on the missing value itself.
| Phone | Screen Size | Price |
|---|---|---|
| iPhone 13 | 6.06 | 999 |
| Galaxy Z Fold 3 | 7.6 | NaN |
| OnePlus 9 Pro | 6.7 | 799 |
| iPhone 12 Pro Max | 6.68 | NaN |
Suppose you have a DataFrame with columns named 'col_1', 'col_2', ..., 'col_k', and want to test whether values in 'col_X' are MCAR.
The following pseudocode describes an algorithm for testing whether 'col_X''s missingness is independent of all other columns in the DataFrame:
for i = 1, 2, ..., k, where i != X:
    look at the distribution of col_i when col_X is missing
    look at distribution of col_i when col_X is not missing
    check if these two distributions are the same
    if so, then col_X's missingness doesn't depend on col_i
    if not, col_X is MAR dependent on col_i
if all pairs of distributions were the same,
then col_X is MCAR
We need to make precise what we mean by "the same"!
heights = pd.read_csv('data/midparent.csv')
heights = heights.rename(columns={'childHeight': 'child'})
heights = heights[['father', 'mother', 'gender', 'child']]
heights.head()
| father | mother | gender | child | |
|---|---|---|---|---|
| 0 | 78.5 | 67.0 | male | 73.2 |
| 1 | 78.5 | 67.0 | female | 69.2 |
| 2 | 78.5 | 67.0 | female | 69.0 |
| 3 | 78.5 | 67.0 | female | 69.0 |
| 4 | 75.5 | 66.5 | male | 73.5 |
Note that there currently aren't any missing values in heights.
heights.isna().mean()
father    0.0
mother    0.0
gender    0.0
child     0.0
dtype: float64
We have three numerical columns – 'father', 'mother', and 'child'. Let's visualize them simultaneously.
pd.plotting.scatter_matrix(heights.drop('gender', axis=1));
'child' MCAR by taking a random subset of heights and setting the corresponding 'child' heights to np.NaN.'child' height.np.random.seed(42) # So that we get the same results each time (for lecture)
heights_mcar = heights.copy()
idx = heights_mcar.sample(frac=0.3).index
heights_mcar.loc[idx, 'child'] = np.NaN
heights_mcar.head(10)
| father | mother | gender | child | |
|---|---|---|---|---|
| 0 | 78.5 | 67.0 | male | 73.2 |
| 1 | 78.5 | 67.0 | female | 69.2 |
| 2 | 78.5 | 67.0 | female | NaN |
| 3 | 78.5 | 67.0 | female | 69.0 |
| 4 | 75.5 | 66.5 | male | 73.5 |
| 5 | 75.5 | 66.5 | male | NaN |
| 6 | 75.5 | 66.5 | female | 65.5 |
| 7 | 75.5 | 66.5 | female | NaN |
| 8 | 75.0 | 64.0 | male | 71.0 |
| 9 | 75.0 | 64.0 | female | 68.0 |
heights_mcar.isna().mean()
father    0.000000
mother    0.000000
gender    0.000000
child     0.299786
dtype: float64
Aside: Why is the value for 'child' in the above Series not exactly 0.3?
heights_mcar¶heights_mcar belongs to one of two groups:'child' is missing.'child' is not missing.'gender', 'mother', and 'father' – separately for these two groups, and check to see if they are similar.heights_mcar.head()
| father | mother | gender | child | |
|---|---|---|---|---|
| 0 | 78.5 | 67.0 | male | 73.2 |
| 1 | 78.5 | 67.0 | female | 69.2 |
| 2 | 78.5 | 67.0 | female | NaN |
| 3 | 78.5 | 67.0 | female | 69.0 |
| 4 | 75.5 | 66.5 | male | 73.5 |
'child' distributions for 'gender'¶gender_dist = (
heights_mcar
.assign(child_missing=heights_mcar['child'].isna())
.pivot_table(index='gender', columns='child_missing', aggfunc='size')
)
gender_dist = gender_dist / gender_dist.sum()
gender_dist
| child_missing | False | True |
|---|---|---|
| gender | ||
| female | 0.487768 | 0.478571 |
| male | 0.512232 | 0.521429 |
'child''s missingness does not depend on 'gender'.'female' doesn't make it any more or less likely that their height is missing than knowing if the child is 'male'.'child' distributions for 'gender'¶'gender' is similar whether or not 'child' is missing.'gender' when 'child' is missing.'gender' when 'child' is not missing.gender_dist.plot(kind='barh', figsize=(5, 4), title='Gender by Missingness of Child Height');

Answer:
The code to run our simulation largely looks the same as in previous permutation tests.
shuffled = heights_mcar.copy()
shuffled['child_missing'] = shuffled['child'].isna()

n_repetitions = 500
tvds = []
for _ in range(n_repetitions):

    # Shuffling genders and assigning back to the DataFrame
    shuffled['gender'] = np.random.permutation(shuffled['gender'])

    # Computing and storing TVD
    pivoted = (
        shuffled
        .pivot_table(index='child_missing', columns='gender', aggfunc='size')
        .apply(lambda x: x / x.sum(), axis=1)
    )

    tvd = pivoted.diff().iloc[:, -1].abs().sum() / 2
    tvds.append(tvd)
obs_tvd = gender_dist.diff(axis=1).iloc[:, -1].abs().sum() / 2
obs_tvd
0.009196155526430771
pval = np.mean(tvds >= obs_tvd)

pd.Series(tvds).plot(kind='hist', density=True, ec='w', bins=10, title=f'p-value: {pval}', label='Simulated TVDs')
plt.axvline(x=obs_tvd, color='red', linewidth=4, label='Observed TVD')
plt.legend();

'gender' when 'child' is missing is the same as the distribution of 'gender' when 'child' is not missing.'child' column is not dependent on 'gender'.'child' distributions for 'father'¶'father' when 'child' is missing.'father' when 'child' is not missing.'child' is not dependent on the height of the 'father'.(
heights_mcar
.assign(child_missing=heights_mcar['child'].isna())
.groupby('child_missing')['father']
.plot(kind='hist', density=True, alpha=0.75, ec='w', bins=20, legend=True,
title="Father's Height by Missingness of Child Height")
);

(
    heights_mcar
    .assign(child_missing=heights_mcar['child'].isna())
    .groupby('child_missing')['father']
    .plot(kind='kde', legend=True, title="Father's Height by Missingness of Child Height")
);

'child' is MCAR¶heights_mcar other than 'child'.'child' is missing is the same as the distribution of the column when 'child' is not missing, then we can conclude 'child' is MCAR.Now, we will make 'child' heights MAR by deleting 'child' heights according to a random procedure that depends on other columns.
np.random.seed(42) # So that we get the same results each time (for lecture)

def make_missing(r):
    rand = np.random.uniform() # Random real number between 0 and 1
    if r['father'] > 72 and rand < 0.5:
        return np.NaN
    elif r['gender'] == 'female' and rand < 0.3:
        return np.NaN
    else:
        return r['child']

heights_mar = heights.copy()
heights_mar['child'] = heights_mar.apply(make_missing, axis=1)
heights_mar.head()
| father | mother | gender | child | |
|---|---|---|---|---|
| 0 | 78.5 | 67.0 | male | NaN |
| 1 | 78.5 | 67.0 | female | 69.2 |
| 2 | 78.5 | 67.0 | female | 69.0 |
| 3 | 78.5 | 67.0 | female | 69.0 |
| 4 | 75.5 | 66.5 | male | NaN |
'child' distributions for 'gender', again¶This time, the distribution of 'gender' in the two groups is very different.
gender_dist = (
    heights_mar
    .assign(child_missing=heights_mar['child'].isna())
    .pivot_table(index='gender', columns='child_missing', aggfunc='size')
)

gender_dist = gender_dist / gender_dist.sum()
gender_dist
| child_missing | False | True |
|---|---|---|
| gender | ||
| female | 0.397386 | 0.881657 |
| male | 0.602614 | 0.118343 |
gender_dist.plot(kind='barh', figsize=(5, 4), title='Gender by Missingness of Child Height');

'child' heights in the dataset with missing values, will it be less than or greater than the average 'child' height in the full dataset?'child' height tends to be missing much more frequently when the child is 'female', and 'child' height in the dataset with missing values will be greater than the average 'child' height in the full dataset. 'child' distributions for 'father', again¶(
heights_mar
.assign(child_missing=heights_mar['child'].isna())
.groupby('child_missing')['father']
.plot(kind='kde', legend=True, title="Father's Height by Missingness of Child Height")
);

Observation:
'father' and 'gender'.The difference in means works well in some cases. Let's look at one such case.
Below, we artificially generate two numerical datasets.
np.random.seed(42) # So that we get the same results each time (for lecture)

N = 1000 # number of samples for each distribution

# Distribution 'A'
distr1 = pd.Series(np.random.normal(0, 1, size=N//2))

# Distribution 'B'
distr2 = pd.Series(np.random.normal(3, 1, size=N//2))

data = pd.concat([distr1, distr2], axis=1, keys=['A', 'B']).unstack().reset_index().drop('level_1', axis=1)
data = data.rename(columns={'level_0': 'group', 0: 'data'})
meanA, meanB = data.groupby('group')['data'].mean().round(7).tolist()
title = f'mean of A: {meanA}\n mean of B: {meanB}'

data.groupby('group')['data'].plot(kind='kde', legend=True, title=title);

Let's generate two distributions that look very different but have the same mean.
np.random.seed(42) # So that we get the same results each time (for lecture)

N = 1000 # number of samples for each distribution

# Distribution 'A'
a = pd.Series(np.random.normal(0, 1, size=N//2))
b = pd.Series(np.random.normal(4, 1, size=N//2))
distr1 = pd.concat([a,b], ignore_index=True)

# Distribution 'B'
distr2 = pd.Series(np.random.normal(distr1.mean(), distr1.std(), size=N))

data = pd.concat([distr1, distr2], axis=1, keys=['A', 'B']).unstack().reset_index().drop('level_1', axis=1)
data = data.rename(columns={'level_0': 'group', 0: 'data'})
meanA, meanB = data.groupby('group')['data'].mean().round(7).tolist()
title = f'mean of A: {meanA}\n mean of B: {meanB}'

data.groupby('group')['data'].plot(kind='kde', legend=True, title=title);

In this case, if we use the difference in means as our test statistic in a permutation test, we will fail to reject the null that the two distributions are different.
n_repetitions = 500
shuffled = data.copy()

diff_means = []
for _ in range(n_repetitions):

    # Shuffling the data and assigning it back to the DataFrame
    shuffled['data'] = np.random.permutation(shuffled['data'])

    # Computing and storing the absolute difference in means
    diff_mean = shuffled.groupby('group')['data'].mean().diff().abs().iloc[-1]
    diff_means.append(diff_mean)

diff_means[:10]
[0.06814385394584077,
 0.01012235918252502,
 0.20021636977312052,
 0.24281549039243333,
 0.010075853494654119,
 0.07500611481190322,
 0.022733963103508614,
 0.0016829212124789272,
 0.015376481518938334,
 0.0859578721994847]
obs_diff = data.groupby('group')['data'].mean().diff().abs().iloc[-1]
pval = np.mean(np.array(diff_means) >= obs_diff)

pd.Series(diff_means).plot(kind='hist', density=True, ec='w', bins=20, title=f'p-value: {pval}', label='Simulated Absolute Differences in Means')
plt.axvline(obs_diff, color='red', label='Observed Difference in Means')
plt.legend();

data.groupby('group')['data'].plot(kind='kde', legend=True);

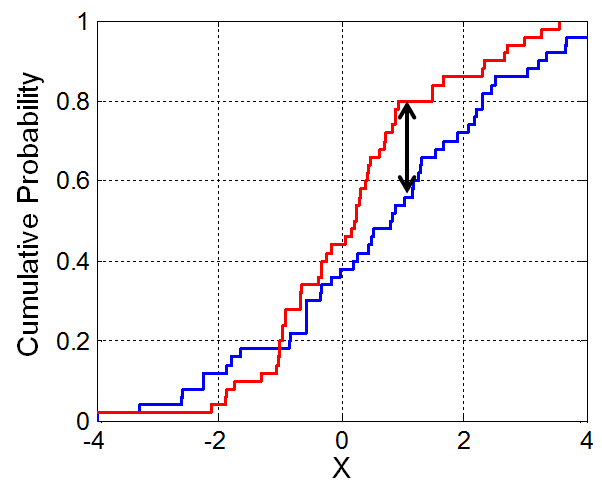
Let's look at the CDFs of our two synthetic distributions.
# Original data
data.groupby('group')['data'].plot(kind='kde', legend=True);
# Try and figure out how this code works!
gpA = data.loc[data['group'] == 'A', 'data']
gpB = data.loc[data['group'] == 'B', 'data']

plt.plot(gpA.value_counts(normalize=True).sort_index().cumsum(), label='CDF of A')
plt.plot(gpB.value_counts(normalize=True).sort_index().cumsum(), label='CDF of B')
plt.legend();

Fortunately, we don't need to calculate the K-S statistic ourselves! Python can do it for us (and you can use this pre-built version in all assignments).
from scipy.stats import ks_2samp
ks_2samp?
obs_ks = ks_2samp(gpA, gpB).statistic
obs_ks
0.14
We don't know if this number is big or small. We need to run a permutation test!
n_repetitions = 500
shuffled = data.copy()

ks_stats = []
for _ in range(n_repetitions):

    # Shuffling the data and assigning it back to the DataFrame
    shuffled['data'] = np.random.permutation(shuffled['data'])

    # Computing and storing the K-S statistic
    groups = shuffled.groupby('group')['data']
    ks_stat = ks_2samp(groups.get_group('A'), groups.get_group('B')).statistic
    ks_stats.append(ks_stat)

ks_stats[:10]
[0.037, 0.048, 0.04, 0.068, 0.045, 0.04, 0.042, 0.052, 0.019, 0.029]
pval = np.mean(np.array(ks_stats) >= obs_ks)

pd.Series(ks_stats).plot(kind='hist', density=True, ec='w', title=f'p-value: {pval}', label='Simulated K-S Statistics')
plt.axvline(obs_diff, color='red', label='Observed K-S Statistic')
plt.legend();

We were able to differentiate between the two distributions using the K-S test statistic!
ks_2samp¶scipy.stats.ks_2samp actually returns both the statistic and a p-value.ks_2samp(gpA, gpB)
KstestResult(statistic=0.14, pvalue=5.822752148022591e-09)
Note: We are not going to get to these slides in class. They're just here to provide more examples of missingness mechanisms.
'vin' number, 'car_make', 'car_year', and 'car_color'.'car_color' missing at random, dependent on 'car_year'?'car_year' similar when color is missing vs. not missing?Let's use a permutation test!
cars = pd.read_csv('data/cars.csv')
cars.head()
| vin | car_make | car_year | car_color | |
|---|---|---|---|---|
| 0 | 3D7TT2CT8BG121773 | Audi | 2008.0 | Teal |
| 1 | SCBZB25E62C073475 | Audi | 1996.0 | Mauv |
| 2 | 1FT7W2A69EE682086 | NaN | NaN | Turquoise |
| 3 | 1B3AZ6JZ7AV582128 | Ford | 2010.0 | Goldenrod |
| 4 | 1GYUCGEF4AR632425 | Mazda | 1996.0 | Purple |
# Proportion of car colors missing
cars['car_color'].isna().mean()
0.1542
cars['color_missing'] = cars['car_color'].isna()
cars.head()
| vin | car_make | car_year | car_color | color_missing | |
|---|---|---|---|---|---|
| 0 | 3D7TT2CT8BG121773 | Audi | 2008.0 | Teal | False |
| 1 | SCBZB25E62C073475 | Audi | 1996.0 | Mauv | False |
| 2 | 1FT7W2A69EE682086 | NaN | NaN | Turquoise | False |
| 3 | 1B3AZ6JZ7AV582128 | Ford | 2010.0 | Goldenrod | False |
| 4 | 1GYUCGEF4AR632425 | Mazda | 1996.0 | Purple | False |
(
    cars
    .pivot_table(index='car_year', columns='color_missing', values=None, aggfunc='size')
    .fillna(0)
    .apply(lambda x: x / x.sum())
    .plot(title='Distribution of Car Years by Missingness of Color')
);

'car_color' depends on 'car_year'.'car_color' is MCAR, we'd need to do a similar analysis for all other columns.'car_color' on 'car_make'¶Let's test whether the missingness of 'car_color' is dependent on 'car_make'.
cars.head()
| vin | car_make | car_year | car_color | color_missing | |
|---|---|---|---|---|---|
| 0 | 3D7TT2CT8BG121773 | Audi | 2008.0 | Teal | False |
| 1 | SCBZB25E62C073475 | Audi | 1996.0 | Mauv | False |
| 2 | 1FT7W2A69EE682086 | NaN | NaN | Turquoise | False |
| 3 | 1B3AZ6JZ7AV582128 | Ford | 2010.0 | Goldenrod | False |
| 4 | 1GYUCGEF4AR632425 | Mazda | 1996.0 | Purple | False |
emp_distributions = (
    cars
    .pivot_table(index='car_make', columns='color_missing', values=None, aggfunc='size')
    .fillna(0)
    .apply(lambda x: x / x.sum())
)

# There are too many makes to plot thema ll at once!
emp_distributions.iloc[:20].plot(kind='barh', title='Distribution of Makes by Missingness of Color');

observed_tvd = emp_distributions.diff(axis=1).iloc[:, -1].abs().sum() / 2
observed_tvd
0.10371381974098398
shuffled = cars.copy()[['car_make', 'color_missing']]

n_repetitions = 500
tvds = []

for _ in range(n_repetitions):

    # Shuffling the colors and assigning them to the DataFrame
    shuffled['car_make'] = np.random.permutation(shuffled['car_make'])

    # Computing and storing the TVD
    pivoted = (
        shuffled
        .pivot_table(index='car_make', columns='color_missing', values=None, aggfunc='size')
        .fillna(0)
        .apply(lambda x: x / x.sum())
    )

    tvd = pivoted.diff(axis=1).iloc[:, -1].abs().sum() / 2
    tvds.append(tvd)
pval = np.mean(tvds >= observed_tvd)

pd.Series(tvds).plot(kind='hist', density=True, ec='w', bins=10, title=f'p-value: {pval}', label='Simulated TVDs')
plt.axvline(x=observed_tvd, color='red', linewidth=4, label='Observed TVD')
plt.legend();

Here, we fail to reject the null that the distribution of 'car_make' is the same whether or not 'car_color' is missing.
payments = pd.read_csv('data/payment.csv')
payments['cc_isnull'] = payments['credit_card_number'].isna()
payments.head()
| id | credit_card_type | credit_card_number | date_of_birth | cc_isnull | |
|---|---|---|---|---|---|
| 0 | 1 | diners-club-enroute | 2.018706e+14 | 25-Sep-1982 | False |
| 1 | 2 | americanexpress | 3.737511e+14 | 08-Jan-1946 | False |
| 2 | 3 | jcb | 3.570296e+15 | NaN | False |
| 3 | 4 | mastercard | 5.318327e+15 | NaN | False |
| 4 | 5 | maestro | 6.759827e+17 | 20-Apr-1975 | False |
emp_distributions = (
    payments
    .pivot_table(columns='cc_isnull', index='credit_card_type', aggfunc='size')
    .fillna(0)
    .apply(lambda x:x / x.sum())
)

emp_distributions.plot(kind='barh', title='distribution of card types');

observed_tvd = np.sum(np.abs(emp_distributions.diff(axis=1).iloc[:,-1])) / 2
observed_tvd
0.08546365914786964
n_repetitions = 500

payments_type = payments.copy()[['credit_card_type', 'cc_isnull']]
tvds = []
for _ in range(n_repetitions):

    shuffled_types = (
        payments_type['credit_card_type']
        .sample(replace=False, frac=1)
        .reset_index(drop=True)
    )

    shuffled = (
        payments_type
        .assign(**{'Shuffled Types': shuffled_types})
    )

    # compute the tvd
    shuffed_emp_distributions = (
        shuffled
        .pivot_table(columns='cc_isnull', index='Shuffled Types', values=None, aggfunc='size')
        .fillna(0)
        .apply(lambda x:x/x.sum())
    )

    tvd = np.sum(np.abs(shuffed_emp_distributions.diff(axis=1).iloc[:,-1])) / 2
    # add it to the list of results

    tvds.append(tvd)
#: visualize
pd.Series(tvds).plot(kind='hist', density=True, alpha=0.8)
plt.scatter(observed_tvd, 0, color='red', s=40);

# p-value
np.count_nonzero(tvds <= observed_tvd) / len(tvds)
0.058
payments['date_of_birth'] = pd.to_datetime(payments.date_of_birth)
payments['age'] = (2019 - payments.date_of_birth.dt.year)
# are the distributions similar?
# Where are the differences? Are they noise, or real?
payments.groupby('cc_isnull').age.plot(kind='kde', title='distribution of ages by missingness of CC', legend=True);

ks_2samp(
    payments.groupby('cc_isnull')['age'].get_group(True),
    payments.groupby('cc_isnull')['age'].get_group(False)
)
KstestResult(statistic=0.12699202780883062, pvalue=0.03445181524401586)
We can use permutation tests to verify if a column is MAR vs. MCAR.
Next time: Using missingness types to impute data (not on the Midterm Exam).