In [1]:
import pandas as pd
import numpy as np
import os

import matplotlib.pyplot as plt
import plotly.express as px
import plotly.graph_objects as go
pd.options.plotting.backend = 'plotly'
TEMPLATE = 'seaborn'

import warnings
warnings.simplefilter('ignore')

Lecture 24 – Decision Trees, Grid Search, Multicollinearity

DSC 80, Spring 2023

Agenda

  • Cross-validation.
  • Example: Decision trees 🌲.
  • Grid search.
  • Multicollinearity.

Cross-validation

Recap

  • Suppose we've decided to fit a polynomial regressor on a dataset $\{(x_1, y_1), (x_2, y_2), ..., (x_n, y_n)\}$, but we're unsure of what degree of polynomial to use (1, 2, 3, ..., 25).
    • Note that polynomial degree is a hyperparameter – it is something we can control before our model is fit to the training data.
  • Or, suppose we have a dataset of restaurant tips, bills, table sizes, days of the week, and so on, and want to decide which features to use in a linear model that predicts tips.
  • Remember, more complicated models (that is, models with more features) don't necessarily generalize well to unseen data!
  • Goal: Find the best hyperparameter, or best choice of features, so that our fit model generalizes well to unseen data.

$k$-fold cross-validation

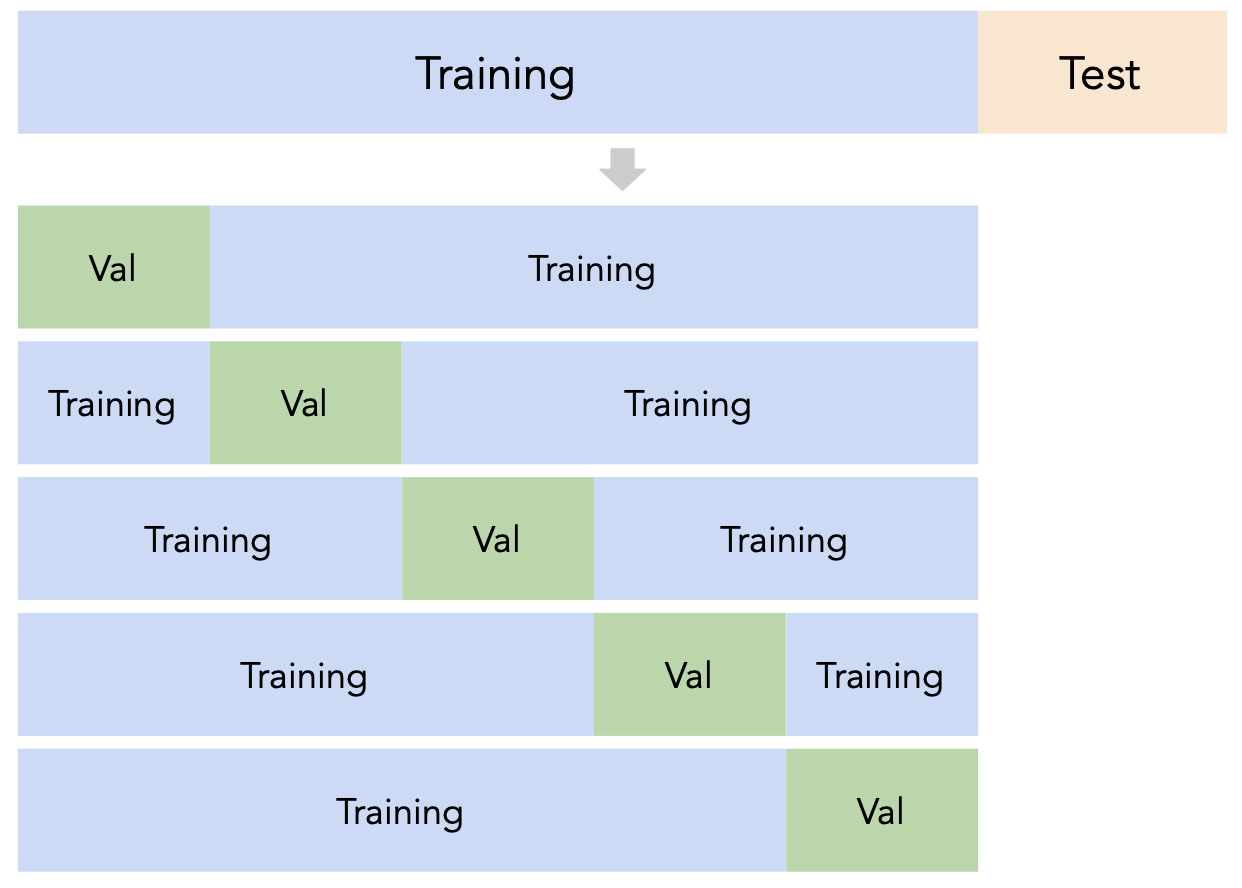
Instead of relying on a single validation set, we can create $k$ validation sets, where $k$ is some positive integer (5 in the example below).

Since each data point is used for training $k-1$ times and validation once, the (averaged) validation performance should be a good metric of a model's ability to generalize to unseen data.

$k$-fold cross-validation (or simply "cross-validation") is the technique we will use for finding hyperparameters.

$k$-fold cross-validation

First, shuffle the dataset randomly and split it into $k$ disjoint groups. Then:

  • For each hyperparameter:
    • For each unique group:
      • Let the unique group be the "validation set".
      • Let all other groups be the "training set".
      • Train a model using the selected hyperparameter on the training set.
      • Evaluate the model on the validation set.
    • Compute the average validation score (e.g. RMSE) for the particular hyperparameter.
  • Choose the hyperparameter with the best average validation score.

As a reminder, here's what "sample 1" looks like.

In [2]:
sample_1 = pd.read_csv(os.path.join('data', 'sample-1.csv'))
px.scatter(x=sample_1['x'], y=sample_1['y'], template=TEMPLATE)

$k$-fold cross-validation in sklearn

  • Let's perform $k$-fold cross validation in order to help us pick a degree for polynomial regression from the list [1, 2, ..., 25].
  • We'll use $k=5$ since it's a common choice (and the default in sklearn).
  • For the sake of this example, we'll suppose sample_1 is our "training + validation data", i.e. that our test data is in some other dataset.
    • If this were not true, we'd first need to split sample_1 into separate training and test sets.
In [3]:
from sklearn.pipeline import Pipeline
from sklearn.preprocessing import PolynomialFeatures
from sklearn.linear_model import LinearRegression
from sklearn.model_selection import cross_val_score
In [4]:
errs_df = pd.DataFrame()

for d in range(1, 26):
    pl = Pipeline([('poly', PolynomialFeatures(d)), ('lin-reg', LinearRegression())])
    
    # The `scoring` argument is used to specify that we want to compute the RMSE; 
    # the default is R^2. It's called "neg" RMSE because, 
    # by default, sklearn likes to "maximize" scores, and maximizing -RMSE is the same
    # as minimizing RMSE.
    errs = cross_val_score(pl, sample_1[['x']], sample_1['y'], 
                           cv=5, scoring='neg_root_mean_squared_error')
    errs_df[f'Deg {d}'] = -errs # Negate to turn positive (sklearn computed negative RMSE).
    
errs_df.index = [f'Fold {i}' for i in range(1, 6)]
errs_df.index.name = 'Validation Fold'

Soon, we'll look at how to implement this procedure without needing to for-loop over values of d.

$k$-fold cross-validation in sklearn

Note that for each choice of degree (our hyperparameter), we have five RMSEs, one for each "fold" of the data. This means that in total, 125 models were trained/fit to data!

In [5]:
errs_df
Out[5]:
Deg 1 Deg 2 Deg 3 Deg 4 Deg 5 Deg 6 Deg 7 Deg 8 Deg 9 Deg 10 ... Deg 16 Deg 17 Deg 18 Deg 19 Deg 20 Deg 21 Deg 22 Deg 23 Deg 24 Deg 25
Validation Fold
Fold 1 4.789975 12.814865 5.040947 4.927487 8.853939 13.150006 18.023855 149.574851 897.759319 718.403458 ... 175100.061819 1.104271e+06 2.266879e+06 1.240113e+06 4.321888e+06 7.223187e+07 8.769372e+06 6.573448e+07 1.412484e+08 5.905400e+08
Fold 2 3.971600 5.359234 3.186076 3.218728 3.194274 3.007987 3.077643 3.127204 3.098704 3.559998 ... 4.123032 5.588813e+00 5.634207e+00 9.640386e+00 2.285274e+01 2.299263e+01 2.929228e+01 7.850244e+01 7.527438e+01 3.133991e+01
Fold 3 4.770176 2.557932 2.083676 2.110708 2.100757 2.013973 2.018524 1.996626 2.186183 3.946495 ... 2.682152 2.764271e+00 2.563292e+00 2.743327e+00 1.790691e+01 1.786843e+01 3.029924e+01 3.090567e+01 4.242471e+01 3.723973e+01
Fold 4 6.134098 4.656187 2.925225 2.932392 3.030811 3.040322 3.144730 3.160528 3.310559 3.070833 ... 7.248788 3.234748e+00 3.065008e+00 1.165178e+01 7.484082e+00 7.543781e+00 6.274905e+00 3.328218e+01 5.804343e+01 9.691238e+00
Fold 5 11.699003 11.916631 3.235882 4.372698 33.584482 51.745272 56.510688 92.223491 335.804723 1168.510898 ... 90577.446194 8.722900e+05 9.204615e+05 8.464799e+06 2.191781e+07 6.018466e+07 8.361500e+06 2.276297e+08 8.168459e+08 6.625413e+09

5 rows × 25 columns

We should choose the degree with the lowest average validation RMSE.

In [6]:
errs_df.mean().idxmin()
Out[6]:
'Deg 3'

Note that if we didn't perform $k$-fold cross-validation, but instead just used a single validation set, we may have ended up with a different result:

In [7]:
errs_df.idxmin(axis=1)
Out[7]:
Validation Fold
Fold 1    Deg 1
Fold 2    Deg 6
Fold 3    Deg 8
Fold 4    Deg 3
Fold 5    Deg 3
dtype: object

*Note*: You may notice that the RMSEs in Folds 1 and 5 are significantly higher than in other folds. Can you think of reasons why, and how we might fix this?

Another example: Tips

We can also use $k$-fold cross-validation to determine which subset of features to use in a linear model that predicts tips (though, as you'll see, the code is not pretty).

In [8]:
import seaborn as sns
tips = sns.load_dataset('tips')
tips.head()
Out[8]:
total_bill tip sex smoker day time size
0 16.99 1.01 Female No Sun Dinner 2
1 10.34 1.66 Male No Sun Dinner 3
2 21.01 3.50 Male No Sun Dinner 3
3 23.68 3.31 Male No Sun Dinner 2
4 24.59 3.61 Female No Sun Dinner 4
In [9]:
from sklearn.compose import ColumnTransformer
from sklearn.preprocessing import FunctionTransformer, OneHotEncoder

As we should always do, we'll perform a train-test split on tips and will only use the training data for cross-validation.

In [10]:
from sklearn.model_selection import train_test_split
In [11]:
X = tips.drop('tip', axis=1)
y = tips['tip']
X_train, X_test, y_train, y_test = train_test_split(X, y, test_size=0.2, random_state=1)
In [12]:
# A dictionary that maps names to Pipeline objects.
pipes = {
    'total_bill only': Pipeline([
        ('trans', ColumnTransformer(
            [('keep', FunctionTransformer(lambda x: x), ['total_bill'])], 
            remainder='drop')), 
        ('lin-reg', LinearRegression())
    ]),
    'total_bill + size': Pipeline([
        ('trans', ColumnTransformer(
            [('keep', FunctionTransformer(lambda x: x), ['total_bill', 'size'])], 
            remainder='drop')), 
        ('lin-reg', LinearRegression())
    ]),
    'total_bill + size + OHE smoker': Pipeline([
        ('trans', ColumnTransformer(
            [('keep', FunctionTransformer(lambda x: x), ['total_bill', 'size']),
             ('ohe', OneHotEncoder(), ['smoker'])], 
            remainder='drop')), 
        ('lin-reg', LinearRegression())
    ]),
    'total_bill + size + OHE all': Pipeline([
        ('trans', ColumnTransformer(
            [('keep', FunctionTransformer(lambda x: x), ['total_bill', 'size']),
             ('ohe', OneHotEncoder(), ['smoker', 'sex', 'time', 'day'])], 
            remainder='drop')), 
        ('lin-reg', LinearRegression())
    ]),
}
In [13]:
pipe_df = pd.DataFrame()

for pipe in pipes:
    errs = cross_val_score(pipes[pipe], X_train, y_train,
                           cv=5, scoring='neg_root_mean_squared_error')
    pipe_df[pipe] = -errs
    
pipe_df.index = [f'Fold {i}' for i in range(1, 6)]
pipe_df.index.name = 'Validation Fold'
In [14]:
pipe_df
Out[14]:
total_bill only total_bill + size total_bill + size + OHE smoker total_bill + size + OHE all
Validation Fold
Fold 1 1.321421 1.273630 1.269500 1.294183
Fold 2 0.951671 0.921717 0.929099 0.934066
Fold 3 0.774420 0.864801 0.858623 0.867915
Fold 4 0.848454 0.838873 0.835130 0.860885
Fold 5 1.102937 1.070329 1.069948 1.083139
In [15]:
pipe_df.mean()
Out[15]:
total_bill only                   0.999780
total_bill + size                 0.993870
total_bill + size + OHE smoker    0.992460
total_bill + size + OHE all       1.008038
dtype: float64
In [16]:
pipe_df.mean().idxmin()
Out[16]:
'total_bill + size + OHE smoker'

Even though the third model has the lowest average validation RMSE, its average validation RMSE is very close to that of the other, simpler models, and as a result we'd likely use the simplest model in practice.

Summary: Generalization

  1. Split the data into two sets: training and test.

  2. Use only the training data when designing, training, and tuning the model.

    • Use $k$-fold cross-validation to choose hyperparameters and estimate the model's ability to generalize.
    • Do not ❌ look at the test data in this step!
  3. Commit to your final model and train it using the entire training set.

  4. Test the data using the test data. If the performance (e.g. RMSE) is not acceptable, return to step 2.

  5. Finally, train on all available data and ship the model to production! 🛳

🚨 This is the process you should always use! 🚨

Discussion Question 🤔

  • Suppose you have a training dataset with 1000 rows.
  • You want to decide between 20 hyperparameters for a particular model.
  • To do so, you perform 10-fold cross-validation.
  • How many times is the first row in the training dataset (X.iloc[0]) used for training a model?

Example: Decision trees 🌲

Decision trees can be used for both regression and classification. We will start by discussing their use in classification.

Example: Predicting diabetes

In [17]:
diabetes = pd.read_csv('data/diabetes.csv')
diabetes.head()
Out[17]:
Pregnancies Glucose BloodPressure SkinThickness Insulin BMI DiabetesPedigreeFunction Age Outcome
0 6 148 72 35 0 33.6 0.627 50 1
1 1 85 66 29 0 26.6 0.351 31 0
2 8 183 64 0 0 23.3 0.672 32 1
3 1 89 66 23 94 28.1 0.167 21 0
4 0 137 40 35 168 43.1 2.288 33 1
In [18]:
# 0 means no diabetes, 1 means yes diabetes.
diabetes['Outcome'].value_counts()
Out[18]:
0    500
1    268
Name: Outcome, dtype: int64
  • 'Glucose' is measured in mg/dL (milligrams per deciliter).
  • 'BMI' is calculated as $\text{BMI} = \frac{\text{weight (kg)}}{\left[ \text{height (m)} \right]^2}$.
  • Let's use 'Glucose' and 'BMI' to predict whether or not a patient has diabetes ('Outcome').

Exploring the dataset

Class 0 (orange) is "no diabetes" and class 1 (blue) is "diabetes".

In [19]:
fig = (
    diabetes.assign(Outcome=diabetes['Outcome'].astype(str))
            .plot(kind='scatter', x='Glucose', y='BMI', color='Outcome', 
                  color_discrete_map={'0': 'orange', '1': 'blue'},
                  title='Relationship between Glucose, BMI, and Diabetes',
                  template=TEMPLATE)
)
fig

Building a decision tree

Let's build a decision tree and interpret the results. But first, a train-test split:

In [20]:
X_train, X_test, y_train, y_test = train_test_split(diabetes[['Glucose', 'BMI']], 
                                                    diabetes['Outcome'],
                                                    random_state=1)

The relevant class is DecisionTreeClassifier, from sklearn.tree.

In [21]:
from sklearn.tree import DecisionTreeClassifier

Note that we fit it the same way we fit earlier estimators.

You may wonder what max_depth=2 does – more on this soon!

In [22]:
dt = DecisionTreeClassifier(max_depth=2)
In [23]:
dt.fit(X_train, y_train)
Out[23]:
DecisionTreeClassifier(max_depth=2)

Visualizing decision trees

Our fit decision tree is like a "flowchart", made up of a series of questions.

As before, orange is "no diabetes" and blue is "diabetes".

In [24]:
from sklearn.tree import plot_tree
In [25]:
plt.figure(figsize=(15, 5))
plot_tree(dt, feature_names=X_train.columns, class_names=['no db', 'yes db'], 
          filled=True, rounded=True, fontsize=15, impurity=False);
  • To classify a new data point, we start at the top and answer the first question (i.e. "Glucose <= 129.5").
  • If the answer is "Yes", we move to the left branch, otherwise we move to the right branch.
  • We repeat this process until we end up at a leaf node, at which point we predict the most common class in that node.
    • Note that each node has a value attribute, which describes the number of training individuals of each class that fell in that node.
In [26]:
# Note that the left node at depth 2 has a `value` of [304, 78].
y_train.loc[X_train[X_train['Glucose'] <= 129.5].index].value_counts()
Out[26]:
0    304
1     78
Name: Outcome, dtype: int64

Evaluating classifiers

The most common evaluation metric in classification is accuracy:

$$\text{accuracy} = \frac{\text{# data points classified correctly}}{\text{# data points}}$$
In [27]:
(dt.predict(X_train) == y_train).mean()
Out[27]:
0.765625

The score method of a classifier computes accuracy by default (just like the score method of a regressor computes $R^2$ by default). We want our classifiers to have high accuracy.

In [28]:
# Training accuracy – same number as above
dt.score(X_train, y_train)
Out[28]:
0.765625
In [29]:
# Testing accuracy
dt.score(X_test, y_test)
Out[29]:
0.7760416666666666

Some questions...

  • How did sklearn learn what questions to ask?
  • Can we get it to ask more questions (i.e. build a deeper tree)?

Training a decision tree

When we ask a question, we are effectively splitting a node into two children – the "yes" child and the "no" child.

Suppose the distribution within a node looks like this (colors represent classes):

🟠🟠🟠🔵🔵🔵🔵🔵🔵🔵

Question A splits the node like this:

  • "Yes": 🟠🟠🔵🔵🔵
  • "No": 🟠🔵🔵🔵🔵

Question B splits the node like this:

  • "Yes": 🔵🔵🔵🔵🔵🔵
  • "No": 🔵🟠🟠🟠

Which question is "better"?

Question B, because there is "less uncertainty" in the resulting nodes after splitting by Question B than there is after splitting by Question A. There are two common techniques for quantifying "uncertainty":

  • Gini impurity (the default in sklearn).
  • Entropy (from information theory).

Not the focus of our course, but read more!

Tree depth

Decision trees are trained by recursively picking the best split until:

  • all "leaf nodes" only contain training examples from a single class (good), or
  • it is impossible to split leaf nodes any further (not good).

By default, there is no "maximum depth" for a decision tree. As such, without restriction, decision trees tend to be very deep.

In [30]:
dt_no_max = DecisionTreeClassifier()
dt_no_max.fit(X_train, y_train)
Out[30]:
DecisionTreeClassifier()

A decision tree fit on our training data has a depth of around 20! (It is so deep that tree.plot_tree errors when trying to plot it.)

In [31]:
dt_no_max.tree_.max_depth
Out[31]:
20

At first, this tree seems "better" than our tree of depth 2, since its training accuracy is much much higher:

In [32]:
dt_no_max.score(X_train, y_train)
Out[32]:
0.9913194444444444
In [33]:
# Depth 2 tree.
dt.score(X_train, y_train)
Out[33]:
0.765625

But recall, we truly care about test set performance, and this decision tree has worse accuracy on the test set than our depth 2 tree.

In [34]:
dt_no_max.score(X_test, y_test)
Out[34]:
0.7135416666666666
In [35]:
# Depth 2 tree.
dt.score(X_test, y_test)
Out[35]:
0.7760416666666666

Decision trees and overfitting

  • Decision trees have a tendency to overfit. Why is that?
  • Unlike linear classification techniques (like logistic regression or SVMs), decision trees are non-linear.
    • They are also "non-parametric" – there are no $w^*$s to learn.
  • While being trained, decision trees ask enough questions to effectively memorize the correct response values in the training set. However, the relationships they learn are often overfit to the noise in the training set, and don't generalize well.
In [36]:
fig
  • A decision tree whose depth is not restricted will achieve 100% accuracy on any training set, as long as there are no "overlapping values" in the training set.
    • Two values overlap when they have the same features $x$ but different response values $y$ (e.g. if two patients have the same glucose levels and BMI, but one has diabetes and one doesn't).
  • One solution: Make the decision tree "less complex" by limiting the maximum depth.

Since sklearn.tree's plot_tree can't visualize extremely large decision trees, let's create and visualize some smaller decision trees.

In [37]:
trees = {}
for d in [2, 4, 8]:
    trees[d] = DecisionTreeClassifier(max_depth=d, random_state=1)
    trees[d].fit(X_train, y_train)
    
    plt.figure(figsize=(15, 5), dpi=100)
    plot_tree(trees[d], feature_names=X_train.columns, class_names=['no db', 'yes db'], 
               filled=True, rounded=True, impurity=False)
    
    plt.show()

As tree depth increases, complexity increases, and our trees are more prone to overfitting.

Question: What is the "right" maximum depth to choose?

Hyperparameters for decision trees

  • max_depth is a hyperparameter for DecisionTreeClassifier.
  • There are many more hyperparameters we can tweak; look at the documentation for examples.
    • min_samples_split: The minimum number of samples required to split an internal node.
    • criterion: The function to measure the quality of a split ('gini' or 'entropy').
  • To ensure that our model generalizes well to unseen data, we need an efficient technique for trying different combinations of hyperparameters!

Grid search

Grid search

GridSearchCV takes in:

  • an un-fit instance of an estimator, and
  • a dictionary of hyperparameter values to try,

and performs $k$-fold cross-validation to find the combination of hyperparameters with the best average validation performance.

In [38]:
from sklearn.model_selection import GridSearchCV

The following dictionary contains the values we're considering for each hyperparameter. (We're using GridSearchCV with 3 hyperparameters, but we could use it with even just a single hyperparameter.)

In [39]:
hyperparameters = {
    'max_depth': [2, 3, 4, 5, 7, 10, 13, 15, 18, None], 
    'min_samples_split': [2, 5, 10, 20, 50, 100, 200],
    'criterion': ['gini', 'entropy']
}

Note that there are 140 combinations of hyperparameters we need to try. We need to find the best combination of hyperparameters, not the best value for each hyperparameter individually.

In [40]:
len(hyperparameters['max_depth']) * \
len(hyperparameters['min_samples_split']) * \
len(hyperparameters['criterion'])
Out[40]:
140

GridSearchCV needs to be instantiated and fit.

In [41]:
searcher = GridSearchCV(DecisionTreeClassifier(), hyperparameters, cv=5)
In [42]:
searcher.fit(X_train, y_train)
Out[42]:
GridSearchCV(cv=5, estimator=DecisionTreeClassifier(),
             param_grid={'criterion': ['gini', 'entropy'],
                         'max_depth': [2, 3, 4, 5, 7, 10, 13, 15, 18, None],
                         'min_samples_split': [2, 5, 10, 20, 50, 100, 200]})

After being fit, the best_params_ attribute provides us with the best combination of hyperparameters to use.

In [43]:
searcher.best_params_
Out[43]:
{'criterion': 'entropy', 'max_depth': 5, 'min_samples_split': 50}

All of the intermediate results – validation accuracies for each fold, mean validation accuaries, etc. – are stored in the cv_results_ attribute:

In [44]:
searcher.cv_results_['mean_test_score'] # Array of length 140.
Out[44]:
array([0.7292054 , 0.7292054 , 0.7292054 , 0.7292054 , 0.7292054 ,
       0.7292054 , 0.72568216, 0.74136432, 0.74136432, 0.74136432,
       0.74136432, 0.74484258, 0.73964018, 0.72568216, 0.7517991 ,
       0.75005997, 0.75005997, 0.74832084, 0.7517991 , 0.7465967 ,
       0.72568216, 0.73613193, 0.73787106, 0.73787106, 0.73787106,
       0.74832084, 0.7465967 , 0.72568216, 0.71362819, 0.71362819,
       0.72923538, 0.73272864, 0.73794603, 0.7465967 , 0.72568216,
       0.71361319, 0.70836582, 0.72049475, 0.72574213, 0.73965517,
       0.7465967 , 0.72568216, 0.6858021 , 0.69793103, 0.70143928,
       0.724003  , 0.7362069 , 0.7465967 , 0.72568216, 0.69797601,
       0.70833583, 0.71358321, 0.724003  , 0.73791604, 0.7465967 ,
       0.72568216, 0.69275862, 0.70487256, 0.7117991 , 0.71878561,
       0.7362069 , 0.7465967 , 0.72568216, 0.69626687, 0.69967016,
       0.70314843, 0.71361319, 0.73968516, 0.7465967 , 0.72568216,
       0.72398801, 0.72398801, 0.72398801, 0.72398801, 0.72398801,
       0.72398801, 0.72394303, 0.74658171, 0.74658171, 0.74658171,
       0.74658171, 0.74658171, 0.73616192, 0.72394303, 0.7517991 ,
       0.7517991 , 0.75005997, 0.75005997, 0.75005997, 0.73964018,
       0.72394303, 0.75004498, 0.75004498, 0.75178411, 0.75178411,
       0.75353823, 0.73964018, 0.72394303, 0.72922039, 0.73095952,
       0.74310345, 0.74484258, 0.75353823, 0.73964018, 0.72394303,
       0.71187406, 0.71361319, 0.73793103, 0.7413943 , 0.75182909,
       0.73964018, 0.72394303, 0.70142429, 0.69970015, 0.72574213,
       0.73791604, 0.74664168, 0.73964018, 0.72394303, 0.69272864,
       0.69446777, 0.72397301, 0.72752624, 0.75008996, 0.73964018,
       0.72394303, 0.68583208, 0.6858021 , 0.71361319, 0.73269865,
       0.75008996, 0.73964018, 0.72394303, 0.68235382, 0.68410795,
       0.71533733, 0.72752624, 0.74664168, 0.73964018, 0.72394303])
In [45]:
# Rows correspond to folds, columns correspond to hyperparameter combinations.
pd.DataFrame(np.vstack([searcher.cv_results_[f'split{i}_test_score'] for i in range(5)]))
Out[45]:
0 1 2 3 4 5 6 7 8 9 ... 130 131 132 133 134 135 136 137 138 139
0 0.706897 0.706897 0.706897 0.706897 0.706897 0.706897 0.732759 0.715517 0.715517 0.715517 ... 0.698276 0.706897 0.732759 0.646552 0.637931 0.681034 0.672414 0.681034 0.706897 0.732759
1 0.773913 0.773913 0.773913 0.773913 0.773913 0.773913 0.756522 0.756522 0.756522 0.756522 ... 0.826087 0.773913 0.756522 0.686957 0.669565 0.756522 0.817391 0.826087 0.773913 0.756522
2 0.739130 0.739130 0.739130 0.739130 0.739130 0.739130 0.730435 0.756522 0.756522 0.756522 ... 0.721739 0.739130 0.730435 0.669565 0.686957 0.695652 0.678261 0.721739 0.739130 0.730435
3 0.704348 0.704348 0.704348 0.704348 0.704348 0.704348 0.704348 0.756522 0.756522 0.756522 ... 0.791304 0.756522 0.695652 0.730435 0.721739 0.730435 0.765217 0.791304 0.756522 0.695652
4 0.721739 0.721739 0.721739 0.721739 0.721739 0.721739 0.704348 0.721739 0.721739 0.721739 ... 0.713043 0.721739 0.704348 0.678261 0.704348 0.713043 0.704348 0.713043 0.721739 0.704348

5 rows × 140 columns

Note that the above DataFrame tells us that 5 * 140 = 700 models were trained in total!

Now that we've found the best combination of hyperparameters, we should fit a decision tree instance using those hyperparameters on our entire training set.

In [46]:
searcher.best_params_
Out[46]:
{'criterion': 'entropy', 'max_depth': 5, 'min_samples_split': 50}
In [47]:
final_tree = DecisionTreeClassifier(**searcher.best_params_)
final_tree
Out[47]:
DecisionTreeClassifier(criterion='entropy', max_depth=5, min_samples_split=50)
In [48]:
final_tree.fit(X_train, y_train)
Out[48]:
DecisionTreeClassifier(criterion='entropy', max_depth=5, min_samples_split=50)
In [49]:
# Training accuracy.
final_tree.score(X_train, y_train)
Out[49]:
0.7829861111111112
In [50]:
# Testing accuracy.
final_tree.score(X_test, y_test)
Out[50]:
0.765625

Remember, searcher itself is a model object (we had to fit it). After performing $k$-fold cross-validation, behind the scenes, searcher is trained on the entire training set using the optimal combination of hyperparameters.

In other words, searcher makes the same predictions that final_tree does!

In [51]:
searcher.score(X_train, y_train)
Out[51]:
0.7829861111111112
In [52]:
searcher.score(X_test, y_test)
Out[52]:
0.765625

Choosing possible hyperparameter values

  • A full grid search can take a long time.
    • In our previous example, we tried 140 combinations of hyperparameters.
    • Since we performed 5-fold cross-validation, we trained 700 decision trees under the hood.
  • Question: How do we pick the possible hyperparameter values to try?
  • Answer: Trial and error.
    • If the "best" choice of a hyperparameter was at an extreme, try increasing the range.
    • For instance, if you try max_depths from 32 to 128, and 32 was the best, try including max_depths under 32.

Key takeaways

  • Decision trees are trained by finding the best questions to ask using the features in the training data. A good question is one that isolates classes as much as possible.
  • Decision trees have a tendency to overfit to training data. One way to mitigate this is by restricting the maximum depth of the tree.
  • To efficiently find hyperparameters through cross-validation, use GridSearchCV.
    • Specify which values to try for each hyperparameter, and GridSearchCV will try all unique combinations of hyperparameters and return the combination with the best average validation performance.
    • GridSearchCV is not the only solution – see RandomizedSearchCV if you're curious.

Multicollinearity

Heights and weights

We have a dataset containing the weights and heights of 25,0000 18 year olds, taken from here.

In [53]:
people = pd.read_csv('data/SOCR-HeightWeight.csv').drop('Index', axis=1)
people.head()
Out[53]:
Height (Inches) Weight (Pounds)
0 65.78331 112.9925
1 71.51521 136.4873
2 69.39874 153.0269
3 68.21660 142.3354
4 67.78781 144.2971
In [54]:
people.plot(kind='scatter', x='Height (Inches)', y='Weight (Pounds)', 
            title='Weight vs. Height for 25,000 18 Year Olds', template=TEMPLATE)

Motivating example

Suppose we fit a simple linear regression model that uses height in inches to predict weight in pounds.

$$\text{predicted weight (pounds)} = w_0 + w_1 \cdot \text{height (inches)}$$
In [55]:
from sklearn.linear_model import LinearRegression
from sklearn.metrics import mean_squared_error
In [56]:
X_train_1, X_test_1, y_train_1, y_test_1 = train_test_split(people[['Height (Inches)']], 
                                                            people['Weight (Pounds)'], 
                                                            random_state=1)
In [57]:
lr_one_feat = LinearRegression()
lr_one_feat.fit(X_train_1, y_train_1)
Out[57]:
LinearRegression()

$w_0^*$ and $w_1^*$ are shown below, along with the model's testing RMSE.

In [58]:
lr_one_feat.intercept_, lr_one_feat.coef_
Out[58]:
(-81.18621383194517, array([3.06263359]))
In [59]:
rmse_one_feat = mean_squared_error(y_test_1, 
                                   lr_one_feat.predict(X_test_1), 
                                   squared=False)
rmse_one_feat
Out[59]:
10.044723811394737

Now, suppose we fit another regression model, that uses height in inches AND height in centimeters to predict weight.

$$\text{predicted weight (pounds)} = w_0 + w_1 \cdot \text{height (inches)} + w_2 \cdot \text{height (cm)}$$
In [60]:
people['Height (cm)'] = people['Height (Inches)'] * 2.54 # 1 inch = 2.54 cm
In [61]:
X_train_2, X_test_2, y_train_2, y_test_2 = train_test_split(people[['Height (Inches)', 'Height (cm)']], 
                                                            people['Weight (Pounds)'], 
                                                            random_state=1)
In [62]:
lr_two_feat = LinearRegression()
lr_two_feat.fit(X_train_2, y_train_2)
Out[62]:
LinearRegression()

What are $w_0^*$, $w_1^*$, $w_2^*$, and the model's testing RMSE?

In [63]:
lr_two_feat.intercept_, lr_two_feat.coef_
Out[63]:
(-81.16135662853335, array([ 7.41066921e+11, -2.91758630e+11]))
In [64]:
rmse_two_feat = mean_squared_error(y_test_2, 
                                   lr_two_feat.predict(X_test_2), 
                                   squared=False)
rmse_two_feat
Out[64]:
10.044966596201823

Observation: The intercept is the same as before (roughly -81.17), as is the testing RMSE. However, the coefficients on 'Height (Inches)' and 'Height (cm)' are massive in size!

What's going on?

Redundant features

Let's use simpler numbers for illustration. Suppose in the first model, $w_0^* = -80$ and $w_1^* = 3$.

$$\text{predicted weight (pounds)} = -80 + 3 \cdot \text{height (inches)}$$

In the second model, we have:

$$\begin{align*}\text{predicted weight (pounds)} &= w_0^* + w_1^* \cdot \text{height (inches)} + w_2^* \cdot \text{height (cm)} \\ &= w_0^* + w_1^* \cdot \text{height (inches)} + w_2^* \cdot \big( 2.54^* \cdot \text{height (inches)} \big) \\ &= w_0^* + \left(w_1^* + 2.54 \cdot w_2^* \right) \cdot \text{height (inches)} \end{align*}$$

In the first model, we already found the "best" intercept ($-80$) and slope ($3$) in a linear model that uses height in inches to predict weight.

So, as long as $w_1^* + 2.54 \cdot w_2^* = 3$ in the second model, the second model's training predictions will be the same as the first, and hence they will also minimize RMSE.

Infinitely many parameter choices

Issue: There are an infinite number of $w_1^*$ and $w_2^*$ that satisfy $w_1^* + 2.54 \cdot w_2^* = 3$!

$$\text{predicted weight} = -80 - 10 \cdot \text{height (inches)} + \frac{13}{2.54} \cdot \text{height (cm)}$$
$$\text{predicted weight} = -80 + 10 \cdot \text{height (inches)} - \frac{7}{2.54} \cdot \text{height (cm)}$$
  • Both prediction rules look very different, but actually make the same predictions.
  • lr.coef_ could return either set of coefficients, or any other of the infinitely many options.
  • But neither set of coefficients is has any meaning!
In [65]:
(-80 - 10 * people.iloc[:, 0] + (13 / 2.54) * people.iloc[:, 2]).head()
Out[65]:
0    117.34993
1    134.54563
2    128.19622
3    124.64980
4    123.36343
dtype: float64
In [66]:
(-80 + 10 * people.iloc[:, 0] - (7 / 2.54) * people.iloc[:, 2]).head()
Out[66]:
0    117.34993
1    134.54563
2    128.19622
3    124.64980
4    123.36343
dtype: float64

Multicollinearity

  • Multicollinearity occurs when features in a regression model are highly correlated with one another.
    • In other words, multicollinearity occurs when a feature can be predicted using a linear combination of other features, fairly accurately.
  • When multicollinearity is present in the features, the coefficients in the model are uninterpretable – they have no meaning.
    • A "slope" represents "the rate of change of $y$ with respect to a feature", when all other features are held constant – but if there's multicollinearity, you can't hold other features constant.
  • Note: Multicollinearity doesn't impact a model's predictions!
    • It doesn't impact a model's ability to generalize to unseen data.
    • If features are multicollinear in the training data, they will probably be multicollinear in the test data too.
  • Solutions:
    • Manually remove highly correlated features.
    • Use a dimensionality reduction technique (such as PCA) to automatically reduce dimensions.

Key takeaways

  • Multicollinearity is present in a linear model when one feature can be accurately predicted using one or more other features.
    • In other words, it is present when a feature is redundant.
  • Multicollinearity doesn't pose an issue for prediction; it doesn't hinder a model's ability to generalize. Instead, it renders the coefficients of a linear model meaningless.

Summary, next time

Summary

See the individual sections for more specific "key takeaways".

Next time

  • Multicollinearity and one hot encoding.
  • Using text features in a predictive model.
  • Metrics for measuring the performance of classifiers other than accuracy.