Axes
- The rows and columns of a DataFrame are both stored as Series.
- The axis specifies the direction of a "slice" of a DataFrame.

- Axis 0 refers to the index (rows).
- Axis 1 refers to the columns.
import pandas as pd
import numpy as np
import matplotlib.pyplot as plt
import os

pd.set_option('display.max_rows', 9)
plt.style.use('ggplot')
loc and iloc.pandas and numpy.plotly.loc and iloc¶Recall, last lecture we started working with a dataset that contains the name, location, enrollment, and founding date of most UCs and CSUs.
schools_path = os.path.join('data', 'california_universities.csv')
schools = pd.read_csv(schools_path)
schools.head()
| Name | City | County | Enrollment | Founded | |
|---|---|---|---|---|---|
| 0 | Humboldt State University | Arcata | Humboldt | 7,774 | 1913 |
| 1 | California State University, Bakersfield | Bakersfield | Kern | 10,493 | 1965 |
| 2 | University of California, Berkeley | Berkeley | Alameda | 42,519 | 1869 |
| 3 | California State University Channel Islands | Camarillo | Ventura | 7,095 | 2002 |
| 4 | California State University, Dominguez Hills | Carson | Los Angeles | 15,741 | 1960 |
loc and iloc with the default index¶loc to access rows by their indexes (labels).iloc to access rows by their integer positions.loc and iloc behave similarly – but they are not the same!schools.head()
| Name | City | County | Enrollment | Founded | |
|---|---|---|---|---|---|
| 0 | Humboldt State University | Arcata | Humboldt | 7,774 | 1913 |
| 1 | California State University, Bakersfield | Bakersfield | Kern | 10,493 | 1965 |
| 2 | University of California, Berkeley | Berkeley | Alameda | 42,519 | 1869 |
| 3 | California State University Channel Islands | Camarillo | Ventura | 7,095 | 2002 |
| 4 | California State University, Dominguez Hills | Carson | Los Angeles | 15,741 | 1960 |
What's the difference between the two DataFrames below?
schools.loc[1:5]
| Name | City | County | Enrollment | Founded | |
|---|---|---|---|---|---|
| 1 | California State University, Bakersfield | Bakersfield | Kern | 10,493 | 1965 |
| 2 | University of California, Berkeley | Berkeley | Alameda | 42,519 | 1869 |
| 3 | California State University Channel Islands | Camarillo | Ventura | 7,095 | 2002 |
| 4 | California State University, Dominguez Hills | Carson | Los Angeles | 15,741 | 1960 |
| 5 | California State University, Chico | Chico | Butte | 17,488 | 1887 |
schools.iloc[1:5]
| Name | City | County | Enrollment | Founded | |
|---|---|---|---|---|---|
| 1 | California State University, Bakersfield | Bakersfield | Kern | 10,493 | 1965 |
| 2 | University of California, Berkeley | Berkeley | Alameda | 42,519 | 1869 |
| 3 | California State University Channel Islands | Camarillo | Ventura | 7,095 | 2002 |
| 4 | California State University, Dominguez Hills | Carson | Los Angeles | 15,741 | 1960 |
Which of the following two expressions evaluate to the name of the youngest school in schools?
schools.sort_values('Founded', ascending=False).iloc[0]['Name']
'University of California, Merced'
schools.sort_values('Founded', ascending=False).loc[0]['Name']
'Humboldt State University'
assign method.pandas methods, assign returns a new DataFrame.schools.head()
| Name | City | County | Enrollment | Founded | |
|---|---|---|---|---|---|
| 0 | Humboldt State University | Arcata | Humboldt | 7,774 | 1913 |
| 1 | California State University, Bakersfield | Bakersfield | Kern | 10,493 | 1965 |
| 2 | University of California, Berkeley | Berkeley | Alameda | 42,519 | 1869 |
| 3 | California State University Channel Islands | Camarillo | Ventura | 7,095 | 2002 |
| 4 | California State University, Dominguez Hills | Carson | Los Angeles | 15,741 | 1960 |
schools.assign(Age=2023 - schools['Founded'])
| Name | City | County | Enrollment | Founded | Age | |
|---|---|---|---|---|---|---|
| 0 | Humboldt State University | Arcata | Humboldt | 7,774 | 1913 | 110 |
| 1 | California State University, Bakersfield | Bakersfield | Kern | 10,493 | 1965 | 58 |
| 2 | University of California, Berkeley | Berkeley | Alameda | 42,519 | 1869 | 154 |
| 3 | California State University Channel Islands | Camarillo | Ventura | 7,095 | 2002 | 21 |
| ... | ... | ... | ... | ... | ... | ... |
| 28 | University of California, Santa Cruz | Santa Cruz | Santa Cruz | 19,700 | 1965 | 58 |
| 29 | California State University, Monterey Bay | Seaside-Marina | Monterey | 7,079 | 1994 | 29 |
| 30 | California State University, Stanislaus | Turlock | Stanislaus | 10,214 | 1957 | 66 |
| 31 | California State University Maritime Academy | Vallejo | Solano | 1,017 | 1929 | 94 |
32 rows × 6 columns
schools.head()
| Name | City | County | Enrollment | Founded | |
|---|---|---|---|---|---|
| 0 | Humboldt State University | Arcata | Humboldt | 7,774 | 1913 |
| 1 | California State University, Bakersfield | Bakersfield | Kern | 10,493 | 1965 |
| 2 | University of California, Berkeley | Berkeley | Alameda | 42,519 | 1869 |
| 3 | California State University Channel Islands | Camarillo | Ventura | 7,095 | 2002 |
| 4 | California State University, Dominguez Hills | Carson | Los Angeles | 15,741 | 1960 |
As an aside, you should try your best to write chained pandas code, as follows:
(
    schools
    .assign(Age=(2023 - schools['Founded']))
    .assign(is_UC=schools['Name'].str.contains('University of California'))
)
| Name | City | County | Enrollment | Founded | Age | is_UC | |
|---|---|---|---|---|---|---|---|
| 0 | Humboldt State University | Arcata | Humboldt | 7,774 | 1913 | 110 | False |
| 1 | California State University, Bakersfield | Bakersfield | Kern | 10,493 | 1965 | 58 | False |
| 2 | University of California, Berkeley | Berkeley | Alameda | 42,519 | 1869 | 154 | True |
| 3 | California State University Channel Islands | Camarillo | Ventura | 7,095 | 2002 | 21 | False |
| ... | ... | ... | ... | ... | ... | ... | ... |
| 28 | University of California, Santa Cruz | Santa Cruz | Santa Cruz | 19,700 | 1965 | 58 | True |
| 29 | California State University, Monterey Bay | Seaside-Marina | Monterey | 7,079 | 1994 | 29 | False |
| 30 | California State University, Stanislaus | Turlock | Stanislaus | 10,214 | 1957 | 66 | False |
| 31 | California State University Maritime Academy | Vallejo | Solano | 1,017 | 1929 | 94 | False |
32 rows × 7 columns
You can also use assign when the desired column name has spaces, by using keyword arguments.
(
    schools
    .assign(**{'Years since Founding': 2023 - schools['Founded']})
)
| Name | City | County | Enrollment | Founded | Years since Founding | |
|---|---|---|---|---|---|---|
| 0 | Humboldt State University | Arcata | Humboldt | 7,774 | 1913 | 110 |
| 1 | California State University, Bakersfield | Bakersfield | Kern | 10,493 | 1965 | 58 |
| 2 | University of California, Berkeley | Berkeley | Alameda | 42,519 | 1869 | 154 |
| 3 | California State University Channel Islands | Camarillo | Ventura | 7,095 | 2002 | 21 |
| ... | ... | ... | ... | ... | ... | ... |
| 28 | University of California, Santa Cruz | Santa Cruz | Santa Cruz | 19,700 | 1965 | 58 |
| 29 | California State University, Monterey Bay | Seaside-Marina | Monterey | 7,079 | 1994 | 29 |
| 30 | California State University, Stanislaus | Turlock | Stanislaus | 10,214 | 1957 | 66 |
| 31 | California State University Maritime Academy | Vallejo | Solano | 1,017 | 1929 | 94 |
32 rows × 6 columns
[].assign, which returns a new DataFrame.# By default, .copy() returns a deep copy of the object it is called on,
# meaning that if you change the copy the original remains unmodified.
schools_copy = schools.copy()
schools_copy.head()
| Name | City | County | Enrollment | Founded | |
|---|---|---|---|---|---|
| 0 | Humboldt State University | Arcata | Humboldt | 7,774 | 1913 |
| 1 | California State University, Bakersfield | Bakersfield | Kern | 10,493 | 1965 |
| 2 | University of California, Berkeley | Berkeley | Alameda | 42,519 | 1869 |
| 3 | California State University Channel Islands | Camarillo | Ventura | 7,095 | 2002 |
| 4 | California State University, Dominguez Hills | Carson | Los Angeles | 15,741 | 1960 |
schools_copy['Age'] = 2023 - schools_copy['Founded']
schools_copy['Name'] = schools_copy['Name'].str.replace('University of California,', 'UC')
Note that we never reassigned schools_copy in the two cells above – that is, we never wrote schools_copy = ... – though it was still modified.
schools_copy.head()
| Name | City | County | Enrollment | Founded | Age | |
|---|---|---|---|---|---|---|
| 0 | Humboldt State University | Arcata | Humboldt | 7,774 | 1913 | 110 |
| 1 | California State University, Bakersfield | Bakersfield | Kern | 10,493 | 1965 | 58 |
| 2 | UC Berkeley | Berkeley | Alameda | 42,519 | 1869 | 154 |
| 3 | California State University Channel Islands | Camarillo | Ventura | 7,095 | 2002 | 21 |
| 4 | California State University, Dominguez Hills | Carson | Los Angeles | 15,741 | 1960 | 63 |
DataFrames, like lists, arrays, and dictionaries, are mutable. As you learned in DSC 20, this means that they can be modified after being created.
Not only does this explain the behavior on the previous slide, but it also explains the following:
schools.head()
| Name | City | County | Enrollment | Founded | |
|---|---|---|---|---|---|
| 0 | Humboldt State University | Arcata | Humboldt | 7,774 | 1913 |
| 1 | California State University, Bakersfield | Bakersfield | Kern | 10,493 | 1965 |
| 2 | University of California, Berkeley | Berkeley | Alameda | 42,519 | 1869 |
| 3 | California State University Channel Islands | Camarillo | Ventura | 7,095 | 2002 |
| 4 | California State University, Dominguez Hills | Carson | Los Angeles | 15,741 | 1960 |
def calculate_age(df):
    df['Age'] = 2023 - df['Founded']
    return df
calculate_age(schools)
| Name | City | County | Enrollment | Founded | Age | |
|---|---|---|---|---|---|---|
| 0 | Humboldt State University | Arcata | Humboldt | 7,774 | 1913 | 110 |
| 1 | California State University, Bakersfield | Bakersfield | Kern | 10,493 | 1965 | 58 |
| 2 | University of California, Berkeley | Berkeley | Alameda | 42,519 | 1869 | 154 |
| 3 | California State University Channel Islands | Camarillo | Ventura | 7,095 | 2002 | 21 |
| ... | ... | ... | ... | ... | ... | ... |
| 28 | University of California, Santa Cruz | Santa Cruz | Santa Cruz | 19,700 | 1965 | 58 |
| 29 | California State University, Monterey Bay | Seaside-Marina | Monterey | 7,079 | 1994 | 29 |
| 30 | California State University, Stanislaus | Turlock | Stanislaus | 10,214 | 1957 | 66 |
| 31 | California State University Maritime Academy | Vallejo | Solano | 1,017 | 1929 | 94 |
32 rows × 6 columns
schools.head()
| Name | City | County | Enrollment | Founded | Age | |
|---|---|---|---|---|---|---|
| 0 | Humboldt State University | Arcata | Humboldt | 7,774 | 1913 | 110 |
| 1 | California State University, Bakersfield | Bakersfield | Kern | 10,493 | 1965 | 58 |
| 2 | University of California, Berkeley | Berkeley | Alameda | 42,519 | 1869 | 154 |
| 3 | California State University Channel Islands | Camarillo | Ventura | 7,095 | 2002 | 21 |
| 4 | California State University, Dominguez Hills | Carson | Los Angeles | 15,741 | 1960 | 63 |
Note that schools was modified, even though we didn't reassign it! These unintended consequences can influence the behavior of test cases on labs and projects, among other things!
To avoid this, it's a good idea to include df = df.copy() as the first line in functions that take DataFrames as input.
def calculate_age(df):
    df = df.copy()
    # Now, the df referenced below is a fresh copy that is unrelated to the df passed in.
    df['Age'] = 2023 - df['Founded']
    return df
You can add and modify rows using loc and iloc. There's a function that can be to add rows, called pd.concat; we'll see it in a few lectures.
schools_copy.iloc[-1, :] = ['University of California, La Jolla',
                            'La Jolla',
                            'San Diego',
                            '80',
                            2023,
                            0]
schools_copy.tail()
| Name | City | County | Enrollment | Founded | Age | |
|---|---|---|---|---|---|---|
| 27 | UC Santa Barbara | Santa Barbara | Santa Barbara | 24,346 | 1891 | 132 |
| 28 | UC Santa Cruz | Santa Cruz | Santa Cruz | 19,700 | 1965 | 58 |
| 29 | California State University, Monterey Bay | Seaside-Marina | Monterey | 7,079 | 1994 | 29 |
| 30 | California State University, Stanislaus | Turlock | Stanislaus | 10,214 | 1957 | 66 |
| 31 | University of California, La Jolla | La Jolla | San Diego | 80 | 2023 | 0 |
schools_copy.loc[-1, :] = ['La Jolla State University',
                           'La Jolla',
                           'San Diego',
                           '10',
                           2023,
                           0]
schools_copy.tail()
| Name | City | County | Enrollment | Founded | Age | |
|---|---|---|---|---|---|---|
| 28 | UC Santa Cruz | Santa Cruz | Santa Cruz | 19,700 | 1965.0 | 58.0 |
| 29 | California State University, Monterey Bay | Seaside-Marina | Monterey | 7,079 | 1994.0 | 29.0 |
| 30 | California State University, Stanislaus | Turlock | Stanislaus | 10,214 | 1957.0 | 66.0 |
| 31 | University of California, La Jolla | La Jolla | San Diego | 80 | 2023.0 | 0.0 |
| -1 | La Jolla State University | La Jolla | San Diego | 10 | 2023.0 | 0.0 |
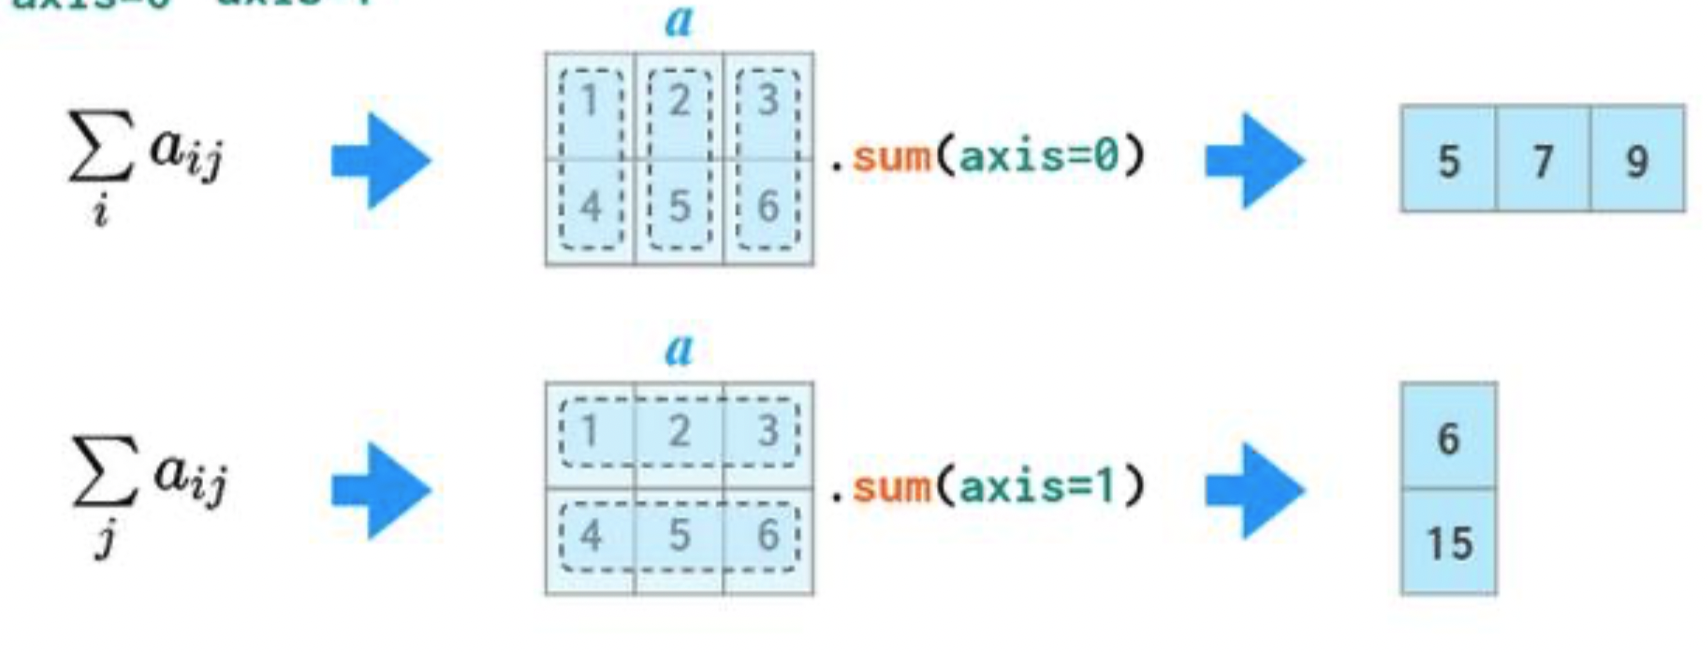
axis¶Consider the DataFrame A defined below using a dictionary.
A = pd.DataFrame({
    'A': [1, 4],
    'B': [2, 5],
    'C': [3, 6]
})
A
| A | B | C | |
|---|---|---|---|
| 0 | 1 | 2 | 3 |
| 1 | 4 | 5 | 6 |
If we specify axis=0, A.sum will "compress" along axis 0, and keep the column labels intact.
A.sum(axis=0)
A    5
B    7
C    9
dtype: int64
If we specify axis=1, A.sum will "compress" along axis 1, and keep the row labels (index) intact.
A.sum(axis=1)
0     6
1    15
dtype: int64
What's the default axis?
A
| A | B | C | |
|---|---|---|---|
| 0 | 1 | 2 | 3 |
| 1 | 4 | 5 | 6 |
A.sum()
A    5
B    7
C    9
dtype: int64
axis¶sum, many other Series methods work on DataFrames.axis argument; the default is usually axis=0.schools.head()
| Name | City | County | Enrollment | Founded | Age | |
|---|---|---|---|---|---|---|
| 0 | Humboldt State University | Arcata | Humboldt | 7,774 | 1913 | 110 |
| 1 | California State University, Bakersfield | Bakersfield | Kern | 10,493 | 1965 | 58 |
| 2 | University of California, Berkeley | Berkeley | Alameda | 42,519 | 1869 | 154 |
| 3 | California State University Channel Islands | Camarillo | Ventura | 7,095 | 2002 | 21 |
| 4 | California State University, Dominguez Hills | Carson | Los Angeles | 15,741 | 1960 | 63 |
# The maximum element in each column.
schools.max()
Name          University of California, Santa Cruz
City                                       Vallejo
County                                        Yolo
Enrollment                                   9,201
Founded                                       2005
Age                                            166
dtype: object
# The number of unique values in each column.
schools.nunique()
Name          32
City          30
County        23
Enrollment    32
Founded       25
Age           25
dtype: int64
# Why is this meaningless?
schools[['Founded', 'Age']].mean(axis=1)
0     1011.5
1     1011.5
2     1011.5
3     1011.5
       ...
28    1011.5
29    1011.5
30    1011.5
31    1011.5
Length: 32, dtype: float64
# describe doesn't accept an axis argument; it works on every numeric column in the DataFrame it is called on.
schools.describe()
| Founded | Age | |
|---|---|---|
| count | 32.000000 | 32.000000 |
| mean | 1938.625000 | 84.375000 |
| std | 38.954688 | 38.954688 |
| min | 1857.000000 | 18.000000 |
| 25% | 1904.000000 | 61.750000 |
| 50% | 1951.500000 | 71.500000 |
| 75% | 1961.250000 | 119.000000 |
| max | 2005.000000 | 166.000000 |
In words, what characteristic do all schools in the following DataFrame share?
schools[schools.nunique(axis=1) != schools.nunique(axis=1).max()]
Hint: What city is SDSU in? What county is it in?
schools.head()
| Name | City | County | Enrollment | Founded | Age | |
|---|---|---|---|---|---|---|
| 0 | Humboldt State University | Arcata | Humboldt | 7,774 | 1913 | 110 |
| 1 | California State University, Bakersfield | Bakersfield | Kern | 10,493 | 1965 | 58 |
| 2 | University of California, Berkeley | Berkeley | Alameda | 42,519 | 1869 | 154 |
| 3 | California State University Channel Islands | Camarillo | Ventura | 7,095 | 2002 | 21 |
| 4 | California State University, Dominguez Hills | Carson | Los Angeles | 15,741 | 1960 | 63 |
pandas and numpy
numpy¶numpy's main object is the array. In numpy, arrays are:numpy is fast because:numpy arrays are stored more efficiently in memory than, say, Python lists. numpy arrays.pandas is built upon numpy¶pandas is a numpy array with an index.numpy array.pandas are fast because they use numpy's implementations.to_numpy method.to_numpy returns a view of the original object, not a copy! Read more in the course notes..values is a soon-to-be-deprecated version of .to_numpy().arr = np.array([4, 2, 9, 15, -1])
arr
array([ 4, 2, 9, 15, -1])
ser = pd.Series(arr, index=['a', 'b', 'c', 'd', 'e'])
ser
a     4
b     2
c     9
d    15
e    -1
dtype: int64
conv = ser.to_numpy()
conv
array([ 4, 2, 9, 15, -1])
conv[2] = 100
conv
array([ 4, 2, 100, 15, -1])
Even though conv appears to be "detached" from ser, it is not:
ser
a      4
b      2
c    100
d     15
e     -1
dtype: int64
for-loops¶for-loops are slow when processing large datasets. You will rarely write for-loops in DSC 80, and may be penalized on assignments for using them when unnecessary!numpy is that it supports vectorized operations. a and b are two arrays of the same length, then a + b is a new array of the same length containing the element-wise sum of a and b.numpy arithmetic is than using a for-loop, let's compute the distances between the origin $(0, 0)$ and 1000 random points $(x, y)$ in $\mathbb{R}^2$:for-loop.numpy.np.random.random(N) returns an array containing N numbers selected uniformly at random from the interval $[0, 1)$.N = 1000
x_arr = np.random.random(N)
y_arr = np.random.random(N)
coordinates = pd.DataFrame({'x': x_arr, 'y': y_arr})
coordinates.head()
| x | y | |
|---|---|---|
| 0 | 0.335446 | 0.874366 |
| 1 | 0.952098 | 0.359232 |
| 2 | 0.137791 | 0.197395 |
| 3 | 0.909567 | 0.424725 |
| 4 | 0.608166 | 0.653802 |
coordinates.plot(kind='scatter', x='x', y='y');

Next, let's define a function that takes in a DataFrame like coordinates and returns the distances between each point and the origin, using a for-loop.
def distances(df):
    hyp_list = []
    for i in df.index:
        dist = (df.loc[i, 'x'] ** 2 + df.loc[i, 'y'] ** 2) ** 0.5
        hyp_list.append(dist)
    return hyp_list

distances(coordinates)[:5]
[0.936504204228518,
 1.0176141363645677,
 0.24073093040462956,
 1.0038440141341902,
 0.8929297176488756]
The %timeit magic command can repeatedly run any snippet of code and give us its average runtime.
%timeit distances(coordinates)
11.1 ms ± 23.1 µs per loop (mean ± std. dev. of 7 runs, 100 loops each)
Now, using a vectorized approach:
%timeit (coordinates['x'] ** 2 + coordinates['y'] ** 2) ** 0.5
134 µs ± 359 ns per loop (mean ± std. dev. of 7 runs, 10000 loops each)
Note that "µs" refers to microseconds, which are one-millionth of a second, whereas "ms" refers to milliseconds, which are one-thousandth of a second.
Takeaway: Avoid for-loops whenever possible!
pandas data types¶dtypes attribute.pandas tries to guess the correct data types for a given DataFrame, and is often wrong.schools.head()
| Name | City | County | Enrollment | Founded | Age | |
|---|---|---|---|---|---|---|
| 0 | Humboldt State University | Arcata | Humboldt | 7,774 | 1913 | 110 |
| 1 | California State University, Bakersfield | Bakersfield | Kern | 10,493 | 1965 | 58 |
| 2 | University of California, Berkeley | Berkeley | Alameda | 42,519 | 1869 | 154 |
| 3 | California State University Channel Islands | Camarillo | Ventura | 7,095 | 2002 | 21 |
| 4 | California State University, Dominguez Hills | Carson | Los Angeles | 15,741 | 1960 | 63 |
schools.dtypes
Name          object
City          object
County        object
Enrollment    object
Founded        int64
Age            int64
dtype: object
schools['Founded'].dtypes
dtype('int64')
pandas data types¶| Pandas dtype | Python type | NumPy type | SQL type | Usage |
|---|---|---|---|---|
| int64 | int | int_, int8,...,int64, uint8,...,uint64 | INT, BIGINT | Integer numbers |
| float64 | float | float_, float16, float32, float64 | FLOAT | Floating point numbers |
| bool | bool | bool_ | BOOL | True/False values |
| datetime64 | NA | datetime64[ns] | DATETIME | Date and time values |
| timedelta[ns] | NA | NA | NA | Differences between two datetimes |
| category | NA | NA | ENUM | Finite list of text values |
| object | str | string, unicode | NA | Text |
| object | NA | object | NA | Mixed types |
This article details how pandas stores different data types under the hood.
What do you think is happening here? 🚰
schools['Founded'] ** 7
0    -7565314117704225911
1     4171128846908943813
2    -6937220880839396315
3    -7155102599657796480
             ...
28    4171128846908943813
29    8892165444775224960
30   -7645595510875556467
31   -4969729423693371399
Name: Founded, Length: 32, dtype: int64
Read this article for a discussion of how numpy/pandas int64 operations differ from vanilla int operations.
numpy and pandas don't always make the same decisions!¶numpy prefers homogenous data types to optimize memory and read/write speed. This leads to type coercion.
Notice that the array created below contains only strings, even though there was an int in the argument list.
np.array(['a', 1])
array(['a', '1'], dtype='<U21')
On the other hand, pandas likes correctness and ease-of-use. The Series created below is of type object, which preserves the original data types in the argument list.
pd.Series(['a', 1])
0    a
1    1
dtype: object
pd.Series(['a', 1]).values
array(['a', 1], dtype=object)
You can specify the data type of an array when initializing it by using the dtype argument.
np.array(['a', 1], dtype=object)
array(['a', 1], dtype=object)
pandas does make some trade-offs for efficiency, however. For instance, a Series consisting of both ints and floats is coerced to the float64 data type.
pd.Series([1, 1.0])
0    1.0
1    1.0
dtype: float64
You can change the data type of a Series using the .astype Series method.
For instance, we can change the data type of the 'Enrollment' column in schools to be int64, once we remove the commas.
schools.head()
| Name | City | County | Enrollment | Founded | Age | |
|---|---|---|---|---|---|---|
| 0 | Humboldt State University | Arcata | Humboldt | 7,774 | 1913 | 110 |
| 1 | California State University, Bakersfield | Bakersfield | Kern | 10,493 | 1965 | 58 |
| 2 | University of California, Berkeley | Berkeley | Alameda | 42,519 | 1869 | 154 |
| 3 | California State University Channel Islands | Camarillo | Ventura | 7,095 | 2002 | 21 |
| 4 | California State University, Dominguez Hills | Carson | Los Angeles | 15,741 | 1960 | 63 |
schools.dtypes
Name          object
City          object
County        object
Enrollment    object
Founded        int64
Age            int64
dtype: object
schools['Enrollment'] = schools['Enrollment'].str.replace(',', '').astype(int)
schools.head()
| Name | City | County | Enrollment | Founded | Age | |
|---|---|---|---|---|---|---|
| 0 | Humboldt State University | Arcata | Humboldt | 7774 | 1913 | 110 |
| 1 | California State University, Bakersfield | Bakersfield | Kern | 10493 | 1965 | 58 |
| 2 | University of California, Berkeley | Berkeley | Alameda | 42519 | 1869 | 154 |
| 3 | California State University Channel Islands | Camarillo | Ventura | 7095 | 2002 | 21 |
| 4 | California State University, Dominguez Hills | Carson | Los Angeles | 15741 | 1960 | 63 |
schools.dtypes
Name          object
City          object
County        object
Enrollment     int64
Founded        int64
Age            int64
dtype: object
As we just discovered,
numpy is optimized for speed and memory consumption.pandas makes implementation choices that: To demonstrate, let's create a large array in which all of the entries are non-negative numbers less than 255, meaning that they can be represented with 8 bits (i.e. as np.uint8s, where the "u" stands for "unsigned").
data = np.random.choice(np.arange(8), 10 ** 6)
When we tell pandas to use a dtype of uint8, the size of the resulting DataFrame is under a megabyte.
ser1 = pd.Series(data, dtype=np.uint8).to_frame()
ser1.info()
<class 'pandas.core.frame.DataFrame'>
RangeIndex: 1000000 entries, 0 to 999999
Data columns (total 1 columns):
 #   Column  Non-Null Count    Dtype
---  ------  --------------    -----
 0   0       1000000 non-null  uint8
dtypes: uint8(1)
memory usage: 976.7 KB
But by default, even though the numbers are only 8-bit, pandas uses the int64 dtype, and the resulting DataFrame is over 7 megabytes large.
ser2 = pd.Series(data).to_frame()
ser2.info()
<class 'pandas.core.frame.DataFrame'>
RangeIndex: 1000000 entries, 0 to 999999
Data columns (total 1 columns):
 #   Column  Non-Null Count    Dtype
---  ------  --------------    -----
 0   0       1000000 non-null  int64
dtypes: int64(1)
memory usage: 7.6 MB
std¶To compute the standard deviation of a Series, we can use:
std method.np.std function.Let's try both. What do you notice?
schools['Founded'].std()
38.95468831778126
np.std(schools['Founded'])
38.34119031798569
std¶The two methods/functions use different degrees of freedom (ddof) by default.
std method in pandas uses ddof=1 by default (sometimes called the "sample" standard deviation):np.std method in numpy uses ddof=0 by default (sometimes called the "population" standard deviation):Be careful!
schools['Founded'].std()
38.95468831778126
schools['Founded'].std(ddof=1)
38.95468831778126
schools['Founded'].std(ddof=0)
38.34119031798569
plotly¶Note: We may not get to these slides in lecture; refer to them for extra examples.
Let's return to schools. Towards the end of the last section, we fixed the data type of the 'Enrollment' column to be int64, which means we can now perform calculations with it.
schools.head()
| Name | City | County | Enrollment | Founded | Age | |
|---|---|---|---|---|---|---|
| 0 | Humboldt State University | Arcata | Humboldt | 7774 | 1913 | 110 |
| 1 | California State University, Bakersfield | Bakersfield | Kern | 10493 | 1965 | 58 |
| 2 | University of California, Berkeley | Berkeley | Alameda | 42519 | 1869 | 154 |
| 3 | California State University Channel Islands | Camarillo | Ventura | 7095 | 2002 | 21 |
| 4 | California State University, Dominguez Hills | Carson | Los Angeles | 15741 | 1960 | 63 |
schools.dtypes
Name          object
City          object
County        object
Enrollment     int64
Founded        int64
Age            int64
dtype: object
schools['Enrollment'].describe()
count       32.000000
mean     23649.781250
std      12477.750595
min       1017.000000
25%      13506.500000
50%      23812.000000
75%      34965.750000
max      45428.000000
Name: Enrollment, dtype: float64
schools.plot(kind='scatter', x='Founded', y='Enrollment', figsize=(10, 5));

plotly¶plotly is a plotting library that creates interactive graphs. It's not included in your dsc80 conda environment, so you'll need to pip install it.
!pip install plotly
Requirement already satisfied: plotly in /Users/surajrampure/opt/anaconda3/lib/python3.9/site-packages (5.4.0)
Requirement already satisfied: tenacity>=6.2.0 in /Users/surajrampure/opt/anaconda3/lib/python3.9/site-packages (from plotly) (8.0.1)
Requirement already satisfied: six in /Users/surajrampure/opt/anaconda3/lib/python3.9/site-packages (from plotly) (1.16.0)
import plotly.express as px
px.scatter(schools,
           x='Founded',
           y='Enrollment',
           hover_name='Name',
           color=schools['Name'].str.contains('University of California')
           )
You can even create plotly plots by default by setting pandas' plotting backend to plotly:
pd.options.plotting.backend = 'plotly'
schools.plot(kind='scatter',
             x='Founded',
             y='Enrollment',
             hover_name='Name')
pandas relies heavily on numpy. An understanding of how data types work in both will allow you to write more efficient and bug-free code.pandas documentation for more details).pandas methods return copies of Series/DataFrames. Be careful when using techniques that modify values in-place.groupby and data granularity.