The Kolmogorov-Smirnov test statistic
- The K-S test statistic measures the similarity between two distributions.
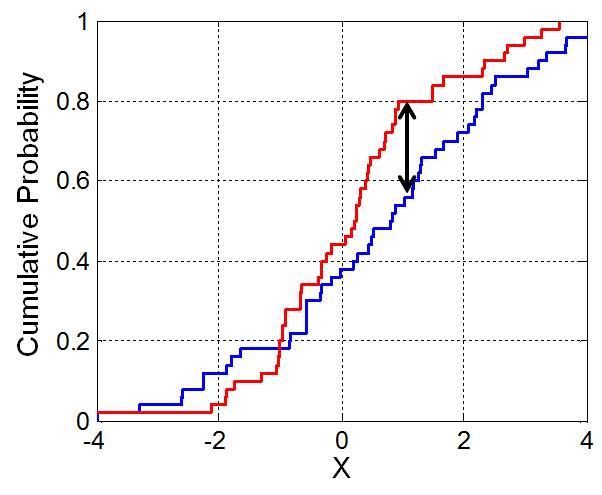
- It is defined in terms of the cumulative distribution function (CDF) of a given distribution.
- If $f(x)$ is a distribution, then the CDF $F(x)$ is the proportion of values in distribution $f$ that are less than or equal to $x$.
- The K-S statistic is roughly defined as the largest difference between two CDFs.