from dsc80_utils import *
Lecture 6 – EDA Part 2, Hypothesis Testing
DSC 80, Fall 2024
In case you need a review from DSC 10, I've made a Pre-Lecture Review for this lecture.
Announcements 📣
- Project 1 is due today, Oct 15.
- Lab 3 is due on Fri, Oct 18.
- When submitting answers for attendance, copy-paste what you have. Answers that are some variant of "I don't know" will be treated as no submission. Take your best guess!
Agenda 📆
- Finish up our EDA example from last lecture
- Data scope.
- Overview of hypothesis testing.
- Example: Total variation distance.
- Permutation testing.
- Example: Birth weight and smoking 🚬.
- Example (that you'll read on your own): Permutation testing meets TVD.
SD Food Safety Data
First, let's retrace our steps from last lecture.
rest_path = Path('data') / 'restaurants.csv'
insp_path = Path('data') / 'inspections.csv'
viol_path = Path('data') / 'violations.csv'
def subset_rest(rest):
return rest[['business_id', 'name', 'address', 'zip', 'opened_date']]
def subset_insp(insp):
return (
insp[['business_id', 'inspection_id', 'score', 'grade', 'completed_date', 'status']]
.rename(columns={'completed_date': 'date'})
)
def subset_viol(viol):
return (
viol[['inspection_id', 'violation', 'major_violation', 'violation_accela']]
.rename(columns={'violation': 'kind',
'major_violation': 'is_major',
'violation_accela': 'violation'})
)
rest = (pd.read_csv(rest_path)
.pipe(subset_rest))
insp = (pd.read_csv(insp_path)
.pipe(subset_insp))
viol = (pd.read_csv(viol_path)
.pipe(subset_viol))
Combining the restaurant data
Let's join all three DataFrames together so that we have all the data in a single DataFrame.
def merge_all_restaurant_data():
return (
rest
.merge(insp, on='business_id', how='left')
.merge(viol, on='inspection_id', how='left')
)
df = merge_all_restaurant_data()
df.head(2)
| business_id | name | address | zip | ... | status | kind | is_major | violation | |
|---|---|---|---|---|---|---|---|---|---|
| 0 | 211898487641 | MOBIL MART LA JOLLA VILLAGE | 3233 LA JOLLA VILLAGE DR, LA JOLLA, CA 92037 | 92037 | ... | Complete | Hot and Cold Water | Y | 21. Hot & cold water available |
| 1 | 211898487641 | MOBIL MART LA JOLLA VILLAGE | 3233 LA JOLLA VILLAGE DR, LA JOLLA, CA 92037 | 92037 | ... | Complete | Hot and Cold Water | N | 21. Hot & cold water available |
2 rows × 13 columns
Question 🤔 (Answer at dsc80.com/q)
Code: lefts
Why should the function above use two left joins? What would go wrong if we used other kinds of joins?
Data cleaning: Missing values
Missing values
Next, it's important to check for and handle missing values, as they can have a big effect on your analysis.
insp[['score', 'grade']]
| score | grade | |
|---|---|---|
| 0 | 96 | NaN |
| 1 | 98 | NaN |
| 2 | 98 | NaN |
| ... | ... | ... |
| 5176 | 0 | NaN |
| 5177 | 0 | NaN |
| 5178 | 90 | A |
5179 rows × 2 columns
# The proportion of values in each column that are missing.
insp.isna().mean()
business_id 0.00 inspection_id 0.00 score 0.00 grade 0.42 date 0.00 status 0.00 dtype: float64
# Why are there null values here?
# insp['inspection_id'] and viol['inspection_id'] don't have any null values...
df[df['inspection_id'].isna()]
| business_id | name | address | zip | ... | status | kind | is_major | violation | |
|---|---|---|---|---|---|---|---|---|---|
| 759 | 211941133403 | TASTY CHAI | 8878 REGENTS RD 105, SAN DIEGO, CA 92122-5853 | 92122-5853 | ... | NaN | NaN | NaN | NaN |
| 1498 | 211915545446 | EMBASSY SUITES SAN DIEGO LA JOLLA | 4550 LA JOLLA VILLAGE DR, SAN DIEGO, CA 92122-... | 92122-1248 | ... | NaN | NaN | NaN | NaN |
| 1672 | 211937443689 | SERVICENOW | 4770 EASTGATE MALL, SAN DIEGO, CA 92121-1970 | 92121-1970 | ... | NaN | NaN | NaN | NaN |
| ... | ... | ... | ... | ... | ... | ... | ... | ... | ... |
| 8094 | 211997340975 | COOKIE SCOOP | 7759 GASTON DR, SAN DIEGO, CA 92126-3036 | 92126-3036 | ... | NaN | NaN | NaN | NaN |
| 8450 | 211900595220 | I LOVE BANANA BREAD CO | 4068 DALLES AVE, SAN DIEGO, CA 92117-5518 | 92117-5518 | ... | NaN | NaN | NaN | NaN |
| 8545 | 211963768842 | PETRA KITCHEN | 5252 BALBOA ARMS DR 175, SAN DIEGO, CA 92117-4949 | 92117-4949 | ... | NaN | NaN | NaN | NaN |
29 rows × 13 columns
There are many ways of handling missing values, which we'll cover in an entire lecture next week. But a good first step is to check how many there are!
Data cleaning: Transformations and timestamps
Transformations and timestamps
From last class:
A transformation results from performing some operation on every element in a sequence, e.g. a Series.
It's often useful to look at ways of transforming your data to make it easier to work with.
Type conversions (e.g. changing the string
"$2.99"to the number2.99).Unit conversion (e.g. feet to meters).
Extraction (Getting
'vermin'out of'Vermin Violation Recorded on 10/10/2023').
Creating timestamps
Most commonly, we'll parse dates into pd.Timestamp objects.
# Look at the dtype!
insp['date']
0 2023-02-16
1 2022-01-03
2 2020-12-03
...
5176 2023-03-06
5177 2022-12-09
5178 2022-11-30
Name: date, Length: 5179, dtype: object
# This magical string tells Python what format the date is in.
# For more info: https://docs.python.org/3/library/datetime.html#strftime-and-strptime-behavior
date_format = '%Y-%m-%d'
pd.to_datetime(insp['date'], format=date_format)
0 2023-02-16
1 2022-01-03
2 2020-12-03
...
5176 2023-03-06
5177 2022-12-09
5178 2022-11-30
Name: date, Length: 5179, dtype: datetime64[ns]
# Another advantage of defining functions is that we can reuse this function
# for the 'opened_date' column in `rest` if we wanted to.
def parse_dates(insp, col):
date_format = '%Y-%m-%d'
dates = pd.to_datetime(insp[col], format=date_format)
return insp.assign(**{col: dates})
insp = (
pd.read_csv(insp_path)
.pipe(subset_insp)
.pipe(parse_dates, 'date')
)
# We should also remake df, since it depends on insp.
# Note that the new insp is used to create df!
df = merge_all_restaurant_data()
# Look at the dtype now!
df['date']
0 2023-02-16
1 2022-01-03
2 2020-12-03
...
8728 2022-11-30
8729 2022-11-30
8730 2022-11-30
Name: date, Length: 8731, dtype: datetime64[ns]
Working with timestamps
- We often want to adjust granularity of timestamps to see overall trends, or seasonality.
- Use the
resamplemethod inpandas(documentation).- Think of it like a version of
groupby, but for timestamps. - For instance,
insp.resample('2W', on='date')separates every two weeks of data into a different group.
- Think of it like a version of
insp.resample('2W', on='date')['score'].mean()
date
2020-01-05 42.67
2020-01-19 59.33
2020-02-02 56.34
...
2023-09-24 66.60
2023-10-08 59.58
2023-10-22 66.81
Freq: 2W-SUN, Name: score, Length: 100, dtype: float64
# Where are those numbers coming from?
insp[
(insp['date'] >= pd.Timestamp('2020-01-05')) &
(insp['date'] < pd.Timestamp('2020-01-19'))
]['score']
10 0
11 92
12 0
...
4709 0
4988 100
5107 96
Name: score, Length: 86, dtype: int64
(insp.resample('2W', on='date')
.size()
.plot(title='Number of Inspections Over Time')
)
The .dt accessor
Like with Series of strings, pandas has a .dt accessor for properties of timestamps (documentation).
insp['date']
0 2023-02-16
1 2022-01-03
2 2020-12-03
...
5176 2023-03-06
5177 2022-12-09
5178 2022-11-30
Name: date, Length: 5179, dtype: datetime64[ns]
insp['date'].dt.day
0 16
1 3
2 3
..
5176 6
5177 9
5178 30
Name: date, Length: 5179, dtype: int32
insp['date'].dt.dayofweek
0 3
1 0
2 3
..
5176 0
5177 4
5178 2
Name: date, Length: 5179, dtype: int32
dow_counts = insp['date'].dt.dayofweek.value_counts()
fig = px.bar(dow_counts)
fig.update_xaxes(tickvals=np.arange(7), ticktext=['Mon', 'Tues', 'Wed', 'Thurs', 'Fri', 'Sat', 'Sun'])
Data cleaning: Modifying structure
Reshaping DataFrames
We often reshape the DataFrame's structure to make it more convenient for analysis. For example, we can:
Simplify structure by removing columns or taking a set of rows for a particular period of time or geographic area.
- We already did this!
Adjust granularity by aggregating rows together.
- To do this, use
groupby(orresample, if working with timestamps).
- To do this, use
Reshape structure, most commonly by using the DataFrame
meltmethod to un-pivot a dataframe.
Using melt
- The
meltmethod is common enough that we'll give it a special mention. - We'll often encounter pivot tables (esp. from government data), which we call wide data.
- The methods we've introduced work better with long-form data, or tidy data.
- To go from wide to long,
melt.

Example usage of melt
wide_example = pd.DataFrame({
'Year': [2001, 2002],
'Jan': [10, 130],
'Feb': [20, 200],
'Mar': [30, 340]
}).set_index('Year')
wide_example
| Jan | Feb | Mar | |
|---|---|---|---|
| Year | |||
| 2001 | 10 | 20 | 30 |
| 2002 | 130 | 200 | 340 |
wide_example.melt(ignore_index=False)
| variable | value | |
|---|---|---|
| Year | ||
| 2001 | Jan | 10 |
| 2002 | Jan | 130 |
| 2001 | Feb | 20 |
| 2002 | Feb | 200 |
| 2001 | Mar | 30 |
| 2002 | Mar | 340 |
Exploration
Question 🤔 (Answer at dsc80.com/q)
Code: qs
What questions do you want me to try and answer with the data? I'll start with a single pre-prepared question, and then answer student questions until we run out of time.
Example question: Can we rank restaurants by their number of violations? How about separately for each zip code?
And why would we want to do that? 🤔
Hypothesis Testing
Why are we learning hypothesis testing again?
You may say,
Didn't we already learn this in DSC 10?
Yes, but:
It's an important concept, but one that's confusing to understand the first time you learn about it.
In addition, in order to properly handle missing values (next lecture), we need to learn how to identify different missingness mechanisms. Doing so requires performing a hypothesis test.
Data scope
Where are we in the data science lifecycle?

Hypothesis testing is a tool for helping us understand the world (some population), given our understanding of the data (some sample).
Data scope
Statistical inference: The practice of drawing conclusions about a population, given a sample.
Target population: All elements of the population you ultimately want to draw conclusions about.
Access frame: All elements that are accessible for you for measurement and observation.
Sample: The subset of the access frame that you actually measured / observed.
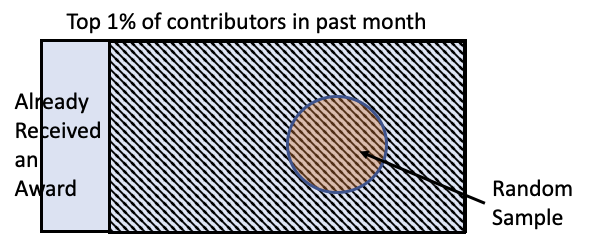
Example: Wikipedia awards
A 2012 paper asked:
If we give awards to Wikipedia contributors, will they contribute more?
To test this question, they took the top 1% of all Wikipedia contributors, excluded those who already received an award, and then took a random sample of 200 contributors.
Example: Who will win the election?
In the 2016 US Presidental Election, most pollsters predicted Clinton to win over Trump, even though Trump ultimately won.
To poll, they randomly selected potential voters and asked them a question over the phone.
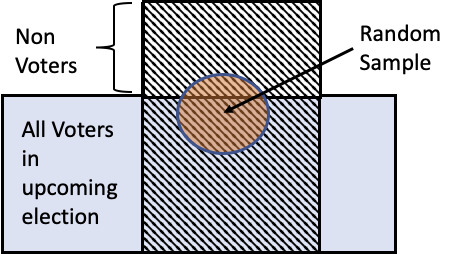
🔑 Key Idea: Random samples look like the access frame they were sampled from!
This enables statistical inference!
But keep in mind, random samples look like their access frame which can be different than the population itself.
Sampling in practice
In DSC 10, you used a few key functions/methods to draw samples from populations.
- To draw samples from a known sequence (e.g. array or Series), you used
np.random.choice.
names = np.load(Path('data') / 'names.npy', allow_pickle=True)
# By default, the sampling is done WITH replacement.
np.random.choice(names, 10)
array(['Brandon', 'Shir', 'Zening', 'Zoey', 'Max', 'Suraj', 'Marcus',
'Lin', 'Aakash', 'Noah'], dtype=object)
# To sample WITHOUT replacement, set replace=False.
# This is known as "simple random sampling."
np.random.choice(names, 10, replace=False)
array(['Aile', 'Kailey', 'Colin', 'Angela', 'Suhani', 'Allen', 'Yihui',
'Chenlong', 'Krystal', 'Shir'], dtype=object)
- The DataFrame
.samplemethod also allowed you to draw samples from a known sequence.
# Samples WITHOUT replacement by default (the opposite of np.random.choice).
pd.DataFrame(names, columns=['name']).sample(10)
| name | |
|---|---|
| 87 | Shir |
| 109 | Zening |
| 70 | Monica |
| ... | ... |
| 1 | Aile |
| 20 | Daniel |
| 102 | Yash |
10 rows × 1 columns
- To sample from a categorical distribution, you used
np.random.multinomial. Note that in the cell below, we don't seearray([50, 50])every time, and that's due to randomness!
# Draws 100 elements from a population in which 50% are group 0 and 50% are group 1.
# This sampling is done WITH replacement.
# In other words, each sampled element has a 50% chance of being group 0 and a 50% chance of being group 1.
np.random.multinomial(100, [0.5, 0.5])
array([58, 42])
Overview of hypothesis testing
What problem does hypothesis testing solve?
Suppose we've performed an experiment, or identified something interesting in our data.
Say we've created a new vaccine.
To assess its efficiency, we give one group the vaccine, and another a placebo.
We notice that the flu rate among those who received the vaccine is lower than among those who received the placebo (i.e. didn't receive the vaccine).
One possibility: the vaccine doesn't actually do anything, and by chance, those with the vaccine happened to have a lower flu rate.
Another possibility: receiving the vaccine made a difference – the flu rate among those who received the vaccine is lower than we'd expect due to random chance.
Hypothesis testing allows us to determine whether an observation is "significant."
Why hypothesis testing is difficult to learn
It's like "proof by contradiction."
If I want to show that my vaccine works, I consider a world where it doesn't (null hypothesis).
Then, I show that under the null hypothesis my data would be very unlikely.
Why go through these mental hurdles? Showing something is not true is usually easier than showing something is true!
The hypothesis testing "recipe"
Faced with a question about the data raised by an observation...
Decide on null and alternate hypotheses.
- The null hypothesis should be a well-defined probability model that reflects the baseline you want to compare against.
- The alternative hypothesis should be the "alternate reality" that you suspect may be true.
Decide on a test statistic, such that a large observed statistic would point to one hypothesis and a small observed statistic would point to the other.
Compute an empirical distribution of the test statistic under the null by drawing samples from the null hypothesis' probability model.
Assess whether the observed test statistic is consistent with the empirical distribution of the test statistic by computing a p-value.


Question 🤔 (Answer at dsc80.com/q)
Code: q10
Complete Problem 10 from the Spring 2023 DSC 10 Final Exam with a neighbor. Submit your answers to dsc80.com/q, then reveal the answers.
Example: Total variation distance
eth = pd.DataFrame(
[['Asian', 0.15, 0.51],
['Black', 0.05, 0.02],
['Latino', 0.39, 0.16],
['White', 0.35, 0.2],
['Other', 0.06, 0.11]],
columns=['Ethnicity', 'California', 'UCSD']
).set_index('Ethnicity')
eth
| California | UCSD | |
|---|---|---|
| Ethnicity | ||
| Asian | 0.15 | 0.51 |
| Black | 0.05 | 0.02 |
| Latino | 0.39 | 0.16 |
| White | 0.35 | 0.20 |
| Other | 0.06 | 0.11 |
The two distributions above are clearly different.
One possibility: UCSD students do look like a random sample of California residents, and the distributions above look different purely due to random chance.
Another possibility: UCSD students don't look like a random sample of California residents, because the distributions above look too different.
Is the difference between the two distributions significant?
Let's establish our hypotheses.
- Null Hypothesis: UCSD students were selected at random from the population of California residents.
- Alternative Hypothesis: UCSD students were not selected at random from the population of California residents.
- Observation: Ethnic distribution of UCSD students.
- Test Statistic: We need a way of quantifying how different two categorical distributions are.
eth.plot(kind='barh', title='Ethnic Distribution of California and UCSD', barmode='group')
How can we summarize the difference, or distance, between these two distributions using just a single number?
Total variation distance
The total variation distance (TVD) is a test statistic that describes the distance between two categorical distributions.
If $A = [a_1, a_2, ..., a_k]$ and $B = [b_1, b_2, ..., b_k]$ are both categorical distributions, then the TVD between $A$ and $B$ is
$$\text{TVD}(A, B) = \frac{1}{2} \sum_{i = 1}^k \big|a_i - b_i\big|$$
Let's compute the TVD between UCSD's ethnic distribution and California's ethnic distribution. We could define a function to do this (and you can use this in assignments):
def tvd(dist1, dist2):
return np.abs(dist1 - dist2).sum() / 2
But let's try and work on the eth DataFrame directly, using the diff method.
# The diff method finds the differences of consecutive elements in a Series.
pd.Series([4, 5, -2]).diff()
0 NaN 1 1.0 2 -7.0 dtype: float64
observed_tvd = eth.diff(axis=1).abs().sum().iloc[1] / 2
observed_tvd
np.float64(0.41000000000000003)
The issue is we don't know whether this is a large value or a small value – we don't know where it lies in the distribution of TVDs under the null.
The plan
To conduct our hypothesis test, we will:
Repeatedly generate samples of size 30,000 (the number of UCSD students) from the ethnic distribution of all of California.
Each time, compute the TVD between the simulated distribution and California's distribution.
This will generate an empirical distribution of TVDs, under the null.
Finally, determine whether the observed TVD (0.41) is consistent with the empirical distribution of TVDs.
Generating one random sample
Again, to sample from a categorical distribution, we use np.random.multinomial.
Important: We must sample from the "population" distribution here, which is the ethnic distribution of everyone in California.
# Number of students at UCSD in this example.
N_STUDENTS = 30_000
eth['California']
Ethnicity Asian 0.15 Black 0.05 Latino 0.39 White 0.35 Other 0.06 Name: California, dtype: float64
np.random.multinomial(N_STUDENTS, eth['California'])
array([ 4549, 1542, 11678, 10392, 1839])
np.random.multinomial(N_STUDENTS, eth['California']) / N_STUDENTS
array([0.15, 0.05, 0.4 , 0.35, 0.06])
Generating many random samples and computing TVDs, without a for-loop
We could write a for-loop to repeat the process on the previous slide repeatedly (and you can in labs and projects). However, the Pre-Lecture Review told us about the size argument in np.random.multinomial, so let's use that here.
eth_draws = np.random.multinomial(N_STUDENTS, eth['California'], size=100_000) / N_STUDENTS
eth_draws
array([[0.15, 0.05, 0.39, 0.36, 0.06],
[0.15, 0.05, 0.39, 0.35, 0.06],
[0.15, 0.05, 0.39, 0.35, 0.06],
...,
[0.15, 0.05, 0.39, 0.35, 0.06],
[0.15, 0.05, 0.39, 0.35, 0.06],
[0.15, 0.05, 0.39, 0.35, 0.06]])
eth_draws.shape
(100000, 5)
Notice that each row of eth_draws sums to 1, because each row is a simulated categorical distribution.
# The values here appear rounded.
tvds = np.abs(eth_draws - eth['California'].to_numpy()).sum(axis=1) / 2
tvds
array([0.01, 0. , 0. , ..., 0. , 0. , 0. ])
Visualizing the empirical distribution of the test statistic
observed_tvd
np.float64(0.41000000000000003)
fig = px.histogram(pd.DataFrame(tvds), x=0, nbins=20, histnorm='probability',
title='Empirical Distribution of the TVD')
fig
(np.array(tvds) >= observed_tvd).mean()
np.float64(0.0)
No, there's not a mistake in our code!
Conclusion
- The chance that the observed TVD came from the distribution of TVDs under the null is essentially 0.
- This matches our intuition from the start – the two distributions looked very different to begin with. But now we're quite sure the difference can't be explained solely due to sampling variation.

Summary of the method
To assess whether an "observed sample" was drawn randomly from a known categorical distribution:
- Use the TVD as the test statistic because it measures the distance between two categorical distributions.
- Sample at random from the population. Compute the TVD between each random sample and the known distribution to get an idea for what reasonable deviations from the eligible pool look like. Repeat this process many, many times.
- Compare:
- the empirical distribution of TVDs, with
- the observed TVD from the sample.
Aside
It was probably obvious that the difference is significant even before running a hypothesis test.
Why? There are 30,000 students. Such a difference in proportion is unlikely to be due to random chance – there's something more systematic at play.
But what if
N_STUDENTS = 300,N_STUDENTS = 30, orN_STUDENTS=3?
eth
| California | UCSD | |
|---|---|---|
| Ethnicity | ||
| Asian | 0.15 | 0.51 |
| Black | 0.05 | 0.02 |
| Latino | 0.39 | 0.16 |
| White | 0.35 | 0.20 |
| Other | 0.06 | 0.11 |
def ethnicity_test(N_STUDENTS):
eth_draws = np.random.multinomial(N_STUDENTS, eth['California'], size=100_000) / N_STUDENTS
tvds = np.sum(np.abs(eth_draws - eth['California'].to_numpy()), axis=1) / 2
return (np.array(tvds) >= observed_tvd).mean()
for i in range(1, 9):
N_STUDENTS = 2 ** i
print(f'With {N_STUDENTS} students, the p-value is {ethnicity_test(N_STUDENTS)}.')
With 2 students, the p-value is 0.72554. With 4 students, the p-value is 0.30572. With 8 students, the p-value is 0.08191. With 16 students, the p-value is 0.00349. With 32 students, the p-value is 1e-05. With 64 students, the p-value is 0.0. With 128 students, the p-value is 0.0. With 256 students, the p-value is 0.0.
Permutation testing
Hypothesis testing vs. permutation testing
- So far, we've used hypothesis tests to answer questions of the form:
I know the population distribution, and I have one sample. Is this sample a likely draw from the population?
- Next, we want to consider questions of the form:
I have two samples, but no information about any population distributions. Do these samples look like they were drawn from different populations? That is, do these two samples look "different"?
Hypothesis testing vs. permutation testing
This framework requires us to be able to draw samples from the baseline population – but what if we don't know that population?
Example: Birth weight and smoking 🚬
For familiarity, we'll start with an example from DSC 10. This means we'll move quickly!
Let's start by loading in the data. Each row corresponds to a mother/baby pair.
baby = pd.read_csv(Path('data') / 'babyweights.csv')
baby
| Birth Weight | Gestational Days | Maternal Age | Maternal Height | Maternal Pregnancy Weight | Maternal Smoker | |
|---|---|---|---|---|---|---|
| 0 | 120 | 284 | 27 | 62 | 100 | False |
| 1 | 113 | 282 | 33 | 64 | 135 | False |
| 2 | 128 | 279 | 28 | 64 | 115 | True |
| ... | ... | ... | ... | ... | ... | ... |
| 1171 | 130 | 291 | 30 | 65 | 150 | True |
| 1172 | 125 | 281 | 21 | 65 | 110 | False |
| 1173 | 117 | 297 | 38 | 65 | 129 | False |
1174 rows × 6 columns
We're only interested in the 'Birth Weight' and 'Maternal Smoker' columns.
baby = baby[['Maternal Smoker', 'Birth Weight']]
baby.head()
| Maternal Smoker | Birth Weight | |
|---|---|---|
| 0 | False | 120 |
| 1 | False | 113 |
| 2 | True | 128 |
| 3 | True | 108 |
| 4 | False | 136 |
Note that there are two samples:
- Birth weights of smokers' babies (rows where
'Maternal Smoker'isTrue). - Birth weights of non-smokers' babies (rows where
'Maternal Smoker'isFalse).
Exploratory data analysis
How many babies are in each group? What is the average birth weight within each group?
baby.groupby('Maternal Smoker')['Birth Weight'].agg(['mean', 'count'])
| mean | count | |
|---|---|---|
| Maternal Smoker | ||
| False | 123.09 | 715 |
| True | 113.82 | 459 |
Note that 16 ounces are in 1 pound, so the above weights are ~7-8 pounds.
Visualizing birth weight distributions
Below, we draw the distributions of both sets of birth weights.
fig = px.histogram(baby, color='Maternal Smoker', histnorm='probability', marginal='box',
title="Birth Weight by Mother's Smoking Status", barmode='overlay', opacity=0.7)
fig
There appears to be a difference, but can it be attributed to random chance?
Null hypothesis: birth weights come from the same distribution
- Our null hypothesis states that "smoker" / "non-smoker" labels have no relationship to birth weight.
- In other words, the "smoker" / "non-smoker" labels may well have been assigned at random.
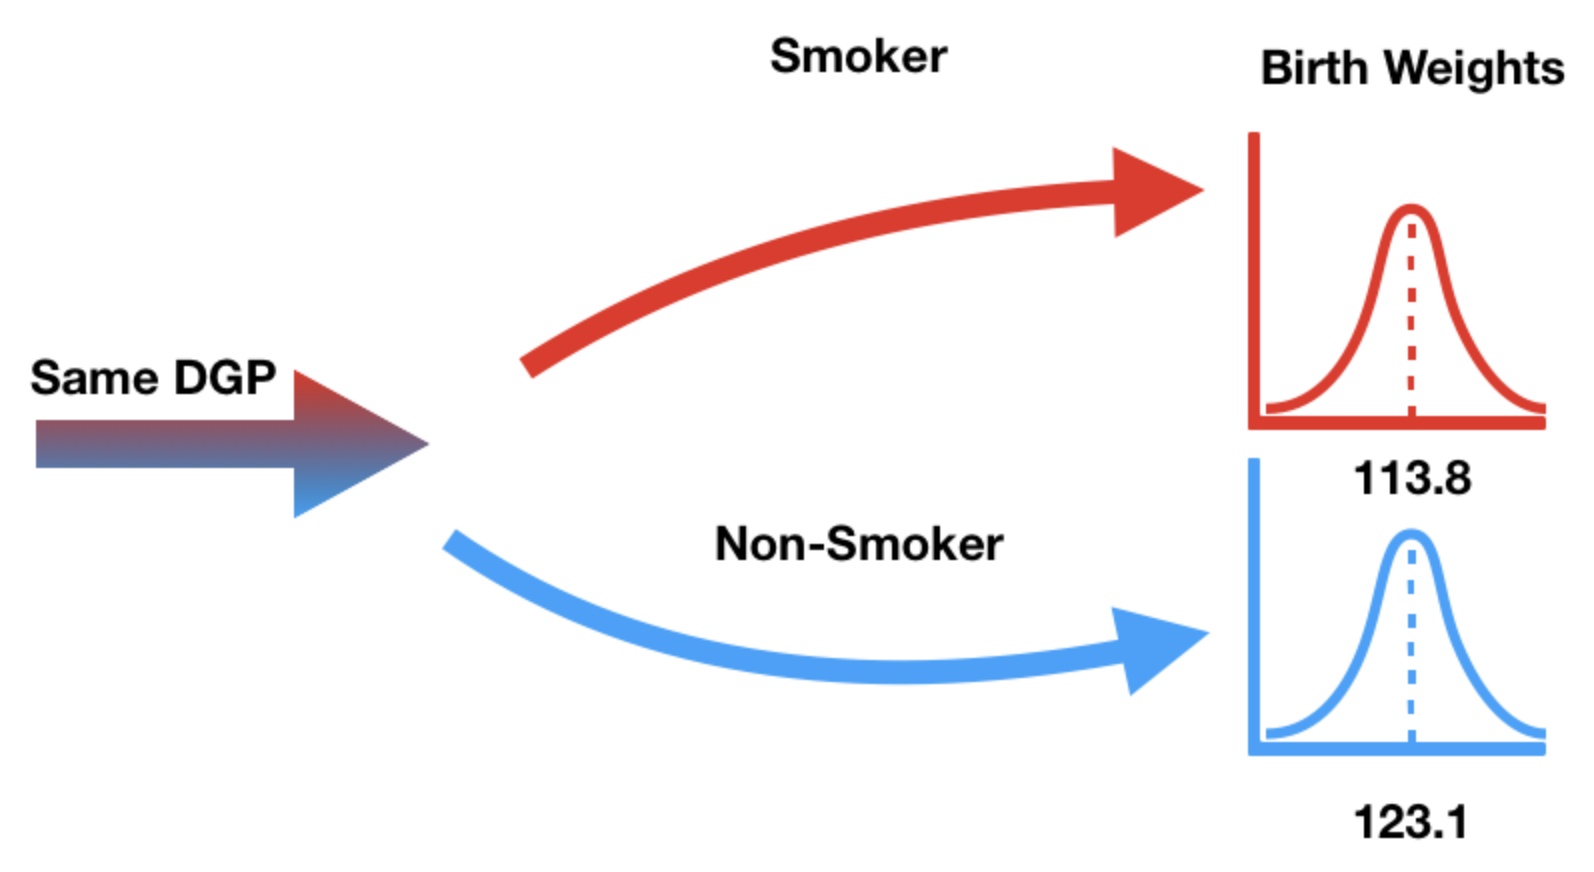
DGP stands for "data generating process" – think of this as another word for population.
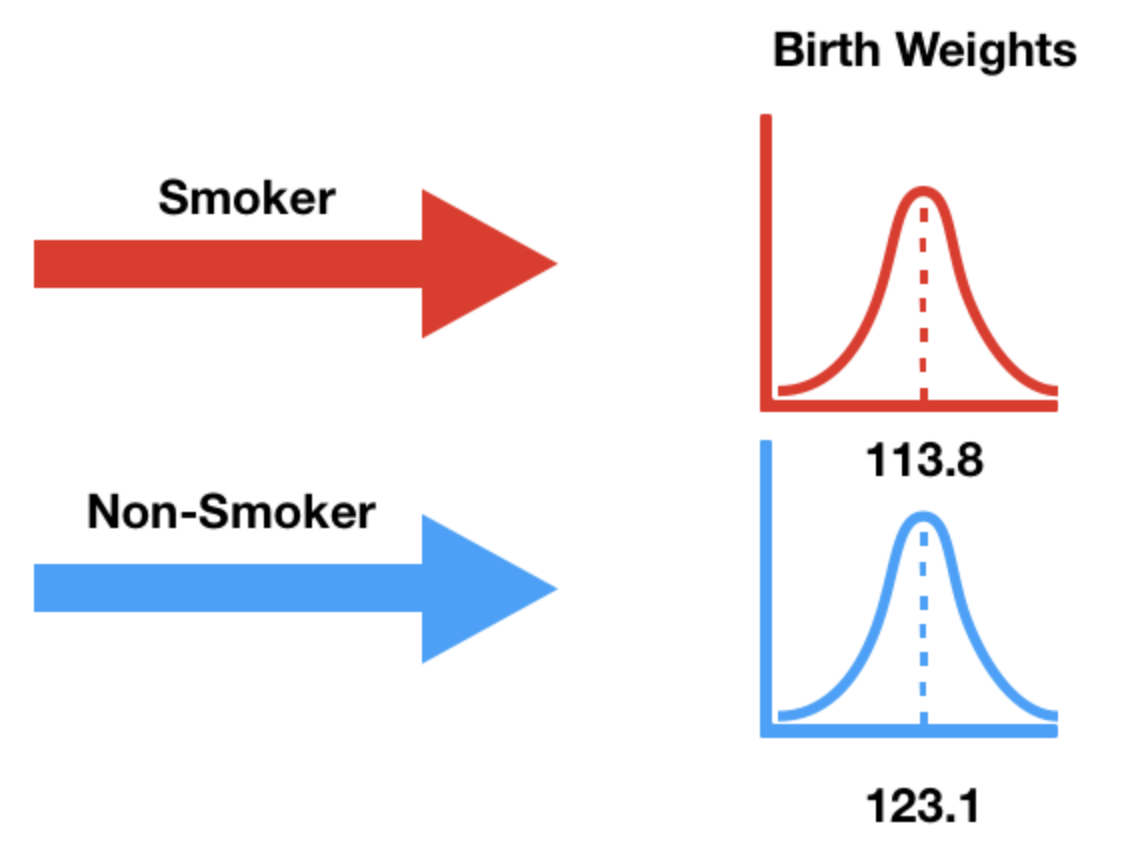
Alternative hypothesis: birth weights come from different distributions
- Our alternative hypothesis states that the birth weights weights of smokers' babies and non-smokers' babies come from different population distributions.
- That is, they come from different data generating processes.
- It also states that smokers' babies weigh significantly less.
Choosing a test statistic
We need a test statistic that can measure how different two numerical distributions are.
fig = px.histogram(baby, color='Maternal Smoker', histnorm='probability', marginal='box',
title="Birth Weight by Mother's Smoking Status", barmode='overlay', opacity=0.7)
fig
Easiest solution: Difference in group means.
Difference in group means
We'll choose our test statistic to be:
$$\text{mean weight of smokers' babies} - \text{mean weight of non-smokers' babies}$$
We could also compute the non-smokers' mean minus the smokers' mean, too.
group_means = baby.groupby('Maternal Smoker')['Birth Weight'].mean()
group_means
Maternal Smoker False 123.09 True 113.82 Name: Birth Weight, dtype: float64
Use loc with group_means to compute the difference in group means.
group_means.loc[True] - group_means.loc[False]
np.float64(-9.266142572024918)
Hypothesis test setup
Null Hypothesis: In the population, birth weights of smokers' babies and non-smokers' babies have the same distribution, and the observed differences in our samples are due to random chance.
Alternative Hypothesis: In the population, smokers' babies have lower birth weights than non-smokers' babies, on average. The observed difference in our samples cannot be explained by random chance alone.
Test Statistic: Difference in group means.
$$\text{mean weight of smokers' babies} - \text{mean weight of non-smokers' babies}$$
- Issue: We don't know what the population distribution actually is – so how do we draw samples from it?
- This is different from the coin flipping, and the California ethnicity examples, because there the null hypotheses were well-defined probability models.
Implications of the null hypothesis
- Under the null hypothesis, both groups are sampled from the same distribution.
- If this is true, then the group label –
'Maternal Smoker'– has no effect on the birth weight. - In our dataset, we saw one assignment of
TrueorFalseto each baby.
baby.head()
| Maternal Smoker | Birth Weight | |
|---|---|---|
| 0 | False | 120 |
| 1 | False | 113 |
| 2 | True | 128 |
| 3 | True | 108 |
| 4 | False | 136 |
- Under the null hypothesis, we were just as likely to see any other assignment.
Permutation tests
In a permutation test, we generate new data by shuffling group labels.
- In our current example, this involves randomly assigning babies to
TrueorFalse, while keeping the same number ofTrues andFalses as we started with.
- In our current example, this involves randomly assigning babies to
On each shuffle, we'll compute our test statistic (difference in group means).
If we shuffle many times and compute our test statistic each time, we will approximate the distribution of the test statistic.
We can them compare our observed statistic to this distribution, as in any other hypothesis test.
Shuffling
Our goal, by shuffling, is to randomly assign values in the
'Maternal Smoker'column to values in the'Birth Weight'column.We can do this by shuffling either column independently.
Easiest solution:
np.random.permutation.- We could also use
df.sample, but it's more complicated (and slower).
- We could also use
np.random.permutation(baby['Birth Weight'])
array([117, 108, 138, ..., 99, 136, 131])
with_shuffled = baby.assign(Shuffled_Weights=np.random.permutation(baby['Birth Weight']))
with_shuffled.head()
| Maternal Smoker | Birth Weight | Shuffled_Weights | |
|---|---|---|---|
| 0 | False | 120 | 132 |
| 1 | False | 113 | 126 |
| 2 | True | 128 | 123 |
| 3 | True | 108 | 106 |
| 4 | False | 136 | 105 |
Now, we have a new sample of smokers' weights, and a new sample of non-smokers' weights!
Effectively, we took a random sample of 459 'Birth Weights' and assigned them to the smokers' group, and the remaining 715 to the non-smokers' group.
How close are the means of the shuffled groups?
One benefit of shuffling 'Birth Weight' (instead of 'Maternal Smoker') is that grouping by 'Maternal Smoker' allows us to see all of the following information with a single call to groupby.
group_means = with_shuffled.groupby('Maternal Smoker').mean()
group_means
| Birth Weight | Shuffled_Weights | |
|---|---|---|
| Maternal Smoker | ||
| False | 123.09 | 118.98 |
| True | 113.82 | 120.22 |
Let's visualize both pairs of distributions – what do you notice?
for x in ['Birth Weight', 'Shuffled_Weights']:
diff = group_means.loc[True, x] - group_means.loc[False, x]
fig = px.histogram(
with_shuffled, x=x, color='Maternal Smoker', histnorm='probability', marginal='box',
title=f"Using the {x} column <br>(difference in means = {diff:.2f})",
barmode='overlay', opacity=0.7)
fig.update_layout(margin=dict(t=60))
fig.show()
Simulating the empirical distribution of the test statistic
This was just one random shuffle.
The question we are trying to answer is, how likely is it that a random shuffle results in two samples where the difference in group means (smoker minus non-smoker) is $\geq$ 9.26?
To answer this question, we need the distribution of the test statistic. To generate that, we must shuffle many, many times. On each iteration, we must:
- Shuffle the weights and store them in a DataFrame.
- Compute the test statistic (difference in group means).
- Store the result.
n_repetitions = 500
differences = []
for _ in range(n_repetitions):
# Step 1: Shuffle the weights and store them in a DataFrame.
with_shuffled = baby.assign(Shuffled_Weights=np.random.permutation(baby['Birth Weight']))
# Step 2: Compute the test statistic.
# Remember, False (0) comes before True (1),
# so this computes True - False.
group_means = (
with_shuffled
.groupby('Maternal Smoker')
.mean()
.loc[:, 'Shuffled_Weights']
)
difference = group_means.loc[True] - group_means.loc[False]
# Step 4: Store the result
differences.append(difference)
differences[:10]
[np.float64(1.8591069061657208), np.float64(-1.031311607782186), np.float64(0.3423526364702809), np.float64(-1.0384661090543545), np.float64(0.7358502064384425), np.float64(1.7982936453524587), np.float64(-2.6804241510123887), np.float64(-0.04041318158965623), np.float64(0.6499961911726615), np.float64(-0.22285296402942834)]
We already computed the observed statistic earlier, but we compute it again below to keep all of our calculations together.
mean_weights = baby.groupby('Maternal Smoker')['Birth Weight'].mean()
observed_difference = mean_weights[True] - mean_weights[False]
observed_difference
np.float64(-9.266142572024918)
Conclusion of the test
fig = px.histogram(
pd.DataFrame(differences), x=0, nbins=50, histnorm='probability',
title='Empirical Distribution of the Mean Differences <br> in Birth Weights (Smoker - Non-Smoker)')
fig.add_vline(x=observed_difference, line_color='red')
fig.update_layout(xaxis_range=[-10, 10], margin=dict(t=60))
Under the null hypothesis, we rarely see differences as large as 9.26 ounces.
Therefore, we reject the null hypothesis that the two groups come from the same distribution. That is, the difference between the two samples is statistically significant.
⚠️ Caution!
- We cannot conclude that smoking causes lower birth weight!
- This was an observational study; there may be confounding factors.
- Maybe smokers are more likely to drink caffeine, and caffeine causes lower birth weight.
Hypothesis testing vs. permutation testing
Permutation tests are hypothesis tests!
"Standard" hypothesis tests answer questions of the form:
I have a population distribution, and I have one sample. Does this sample look like it was drawn from the population?
- Permutation tests answer questions of the form:
I have two samples, but no information about any population distributions. Do these samples look like they were drawn from the same population? That is, do these two samples look "similar"?
Question 🤔 (Answer at dsc80.com/q)
Code: gpa22
This question was taken from the Spring 2022 Midterm Exam.
Consider the following pair of hypotheses.
Null Hypothesis: The average GPA of UC San Diego admits from La Jolla Private is equal to the average GPA of UC San Diego admits from all schools.
Alternative Hypothesis: The average GPA of UC San Diego admits from La Jolla Private is less than the average GPA of UC San Diego admits from all schools.
What type of test is this?
- A. Standard hypothesis test
- B. Permutation test
Question 🤔 (Answer at dsc80.com/q)
Code: dist22
This question was taken from the Spring 2022 Midterm Exam.
Consider the following pair of hypotheses.
Null Hypothesis: The distribution of admitted, waitlisted, and rejected students at UC San Diego from Warren High is equal to the distribution of admitted, waitlisted, and rejected students at UC San Diego from La Jolla Private.
Alternative Hypothesis: The distribution of admitted, waitlisted, and rejected students at UC San Diego from Warren High is different from the distribution of admitted, waitlisted, and rejected students at UC San Diego from La Jolla Private.
What type of test is this?
- A. Standard hypothesis test
- B. Permutation test
Permutation testing meets TVD
Note: This section has another hypothesis testing example. We might not have time to cover the example in lecture, but you should understand it.
You can also watch this podcast, starting from 4:43 for a walkthrough.
Example: Married vs. unmarried couples
- We will use data from a study conducted in 2010 by the National Center for Family and Marriage Research.
- The data consists of a national random sample of over 1,000 heterosexual couples who were either married or living together but unmarried.
- Each row corresponds to one person (not one couple).
couples = pd.read_csv(Path('data') / 'married_couples.csv')
couples.head()
| hh_id | gender | mar_status | rel_rating | ... | education | hh_income | empl_status | hh_internet | |
|---|---|---|---|---|---|---|---|---|---|
| 0 | 0 | 1 | 1 | 1 | ... | 12 | 14 | 1 | 1 |
| 1 | 0 | 2 | 1 | 1 | ... | 9 | 14 | 1 | 1 |
| 2 | 1 | 1 | 1 | 1 | ... | 11 | 15 | 1 | 1 |
| 3 | 1 | 2 | 1 | 1 | ... | 9 | 15 | 1 | 1 |
| 4 | 2 | 1 | 1 | 1 | ... | 12 | 14 | 1 | 1 |
5 rows × 9 columns
# What does this expression compute?
couples['hh_id'].value_counts().value_counts()
count 2 1033 1 2 Name: count, dtype: int64
We won't use all of the columns in the DataFrame.
couples = couples[['mar_status', 'empl_status', 'gender', 'age']]
couples.head()
| mar_status | empl_status | gender | age | |
|---|---|---|---|---|
| 0 | 1 | 1 | 1 | 51 |
| 1 | 1 | 1 | 2 | 53 |
| 2 | 1 | 1 | 1 | 57 |
| 3 | 1 | 1 | 2 | 57 |
| 4 | 1 | 1 | 1 | 60 |
Cleaning the dataset
The numbers in the DataFrame correspond to the mappings below.
'mar_status': 1=married, 2=unmarried.'empl_status': enumerated in the list below.'gender': 1=male, 2=female.'age': person's age in years.
couples.head()
| mar_status | empl_status | gender | age | |
|---|---|---|---|---|
| 0 | 1 | 1 | 1 | 51 |
| 1 | 1 | 1 | 2 | 53 |
| 2 | 1 | 1 | 1 | 57 |
| 3 | 1 | 1 | 2 | 57 |
| 4 | 1 | 1 | 1 | 60 |
empl = [
'Working as paid employee',
'Working, self-employed',
'Not working - on a temporary layoff from a job',
'Not working - looking for work',
'Not working - retired',
'Not working - disabled',
'Not working - other'
]
couples = couples.replace({
'mar_status': {1: 'married', 2: 'unmarried'},
'gender': {1: 'M', 2: 'F'},
'empl_status': {(k + 1): empl[k] for k in range(len(empl))}
})
couples.head()
| mar_status | empl_status | gender | age | |
|---|---|---|---|---|
| 0 | married | Working as paid employee | M | 51 |
| 1 | married | Working as paid employee | F | 53 |
| 2 | married | Working as paid employee | M | 57 |
| 3 | married | Working as paid employee | F | 57 |
| 4 | married | Working as paid employee | M | 60 |
Understanding the couples dataset
- Who is in our dataset? Mostly young people? Mostly married people? Mostly employed people?
- What is the distribution of values in each column?
# For categorical columns, this shows the 10 most common values and their frequencies.
# For numerical columns, this shows the result of calling the .describe() method.
for col in couples:
if couples[col].dtype == 'object':
empr = couples[col].value_counts(normalize=True).to_frame().iloc[:10]
else:
empr = couples[col].describe().to_frame()
display(empr)
| proportion | |
|---|---|
| mar_status | |
| married | 0.72 |
| unmarried | 0.28 |
| proportion | |
|---|---|
| empl_status | |
| Working as paid employee | 0.61 |
| Not working - other | 0.10 |
| Working, self-employed | 0.10 |
| Not working - looking for work | 0.07 |
| Not working - disabled | 0.06 |
| Not working - retired | 0.05 |
| Not working - on a temporary layoff from a job | 0.02 |
| proportion | |
|---|---|
| gender | |
| M | 0.5 |
| F | 0.5 |
| age | |
|---|---|
| count | 2068.00 |
| mean | 43.17 |
| std | 11.91 |
| ... | ... |
| 50% | 44.00 |
| 75% | 53.00 |
| max | 64.00 |
8 rows × 1 columns
Let's look at the distribution of age separately for married couples and unmarried couples.
px.histogram(couples, x='age', color='mar_status', histnorm='probability', marginal='box',
barmode='overlay', opacity=0.7)
How are these two distributions different? Why do you think there is a difference?
Understanding employment status in households
- Do married households more often have a stay-at-home spouse?
- Do households with unmarried couples more often have someone looking for work?
- How much does the employment status of the different households vary?
To answer these questions, let's compute the distribution of employment status conditional on household type (married vs. unmarried).
couples.sample(5).head()
| mar_status | empl_status | gender | age | |
|---|---|---|---|---|
| 1282 | married | Not working - other | M | 52 |
| 1221 | married | Working as paid employee | F | 42 |
| 1591 | unmarried | Not working - disabled | F | 59 |
| 1338 | married | Working as paid employee | M | 56 |
| 1577 | married | Working as paid employee | F | 41 |
# Note that this is a shortcut to picking a column for values and using aggfunc='count'.
empl_cnts = couples.pivot_table(index='empl_status', columns='mar_status', aggfunc='size')
empl_cnts
| mar_status | married | unmarried |
|---|---|---|
| empl_status | ||
| Not working - disabled | 72 | 45 |
| Not working - looking for work | 71 | 69 |
| Not working - on a temporary layoff from a job | 21 | 13 |
| Not working - other | 182 | 33 |
| Not working - retired | 94 | 11 |
| Working as paid employee | 906 | 347 |
| Working, self-employed | 138 | 66 |
Since there are a different number of married and unmarried couples in the dataset, we can't compare the numbers above directly. We need to convert counts to proportions, separately for married and unmarried couples.
empl_cnts.sum()
mar_status married 1484 unmarried 584 dtype: int64
cond_distr = empl_cnts / empl_cnts.sum()
cond_distr
| mar_status | married | unmarried |
|---|---|---|
| empl_status | ||
| Not working - disabled | 0.05 | 0.08 |
| Not working - looking for work | 0.05 | 0.12 |
| Not working - on a temporary layoff from a job | 0.01 | 0.02 |
| Not working - other | 0.12 | 0.06 |
| Not working - retired | 0.06 | 0.02 |
| Working as paid employee | 0.61 | 0.59 |
| Working, self-employed | 0.09 | 0.11 |
Both of the columns above sum to 1.
Differences in the distributions
Are the distributions of employment status for married people and for unmarried people who live with their partners different?
Is this difference just due to noise?
cond_distr.plot(kind='barh', title='Distribution of Employment Status, Conditional on Household Type', barmode='group')
Permutation test for household composition
Null Hypothesis: In the US, the distribution of employment status among those who are married is the same as among those who are unmarried and live with their partners. The difference between the two observed samples is due to chance.
Alternative Hypothesis: In the US, the distributions of employment status of the two groups are different.
Total variation distance
- Whenever we need to compare two categorical distributions, we use the TVD.
- Recall, the TVD is the sum of the absolute differences in proportions, divided by 2.
- In DSC 10, the only test statistic we ever used in permutation tests was the difference in group means/medians, but the TVD can be used in permutation tests as well.
cond_distr
| mar_status | married | unmarried |
|---|---|---|
| empl_status | ||
| Not working - disabled | 0.05 | 0.08 |
| Not working - looking for work | 0.05 | 0.12 |
| Not working - on a temporary layoff from a job | 0.01 | 0.02 |
| Not working - other | 0.12 | 0.06 |
| Not working - retired | 0.06 | 0.02 |
| Working as paid employee | 0.61 | 0.59 |
| Working, self-employed | 0.09 | 0.11 |
Let's first compute the observed TVD:
(cond_distr['unmarried'] - cond_distr['married']).abs().sum() / 2
np.float64(0.1269754089281099)
Since we'll need to calculate the TVD repeatedly, let's define a function that computes it.
def tvd_of_groups(df, groups, cats):
'''groups: the binary column (e.g. married vs. unmarried).
cats: the categorical column (e.g. employment status).
'''
cnts = df.pivot_table(index=cats, columns=groups, aggfunc='size')
# Normalize each column.
distr = cnts / cnts.sum()
# Compute and return the TVD.
return (distr['unmarried'] - distr['married']).abs().sum() / 2
# Same result as above.
observed_tvd = tvd_of_groups(couples, groups='mar_status', cats='empl_status')
observed_tvd
np.float64(0.1269754089281099)
Simulation
- Under the null hypothesis, marital status is not related to employment status.
- We can shuffle the marital status column and get an equally-likely dataset.
- On each shuffle, we will compute the TVD.
- Once we have many TVDs, we can ask, how often do we see a difference at least as large as our observed difference?
couples.head()
| mar_status | empl_status | gender | age | |
|---|---|---|---|---|
| 0 | married | Working as paid employee | M | 51 |
| 1 | married | Working as paid employee | F | 53 |
| 2 | married | Working as paid employee | M | 57 |
| 3 | married | Working as paid employee | F | 57 |
| 4 | married | Working as paid employee | M | 60 |
Here, we'll shuffle marital statuses, though remember, we could shuffle employment statuses too.
couples.assign(shuffled_mar=np.random.permutation(couples['mar_status']))
| mar_status | empl_status | gender | age | shuffled_mar | |
|---|---|---|---|---|---|
| 0 | married | Working as paid employee | M | 51 | married |
| 1 | married | Working as paid employee | F | 53 | married |
| 2 | married | Working as paid employee | M | 57 | unmarried |
| ... | ... | ... | ... | ... | ... |
| 2065 | unmarried | Working as paid employee | F | 53 | married |
| 2066 | unmarried | Working as paid employee | M | 44 | unmarried |
| 2067 | unmarried | Working as paid employee | F | 42 | married |
2068 rows × 5 columns
Let's do this repeatedly.
N = 1000
tvds = []
for _ in range(N):
# Shuffle marital statuses.
with_shuffled = couples.assign(shuffled_mar=np.random.permutation(couples['mar_status']))
# Compute and store the TVD.
tvd = tvd_of_groups(with_shuffled, groups='shuffled_mar', cats='empl_status')
tvds.append(tvd)
Notice that by defining a function that computes our test statistic, our simulation code is much cleaner.
Conclusion of the test
fig = px.histogram(tvds, x=0, nbins=50, histnorm='probability',
title='Empirical Distribution of the TVD')
fig.update_layout(xaxis_range=[0, 0.2])
We reject the null hypothesis that married/unmarried households have similar employment makeups.
We can't say anything about why the employment makeups are different, though!
Summary, next time
Summary
- Both "standard" hypothesis tests and permutation tests are forms of hypothesis tests, which are used to assess whether some observation in our data looks significant.
- See the end of the "Permutation testing" section for the distinction between the two.
- To run a hypothesis test, we need to choose a test statistic such that large observed values point to one hypothesis and small observed values point to the other. Examples we've seen:
- Number of heads, absolute difference between number of heads and expected number of heads (coin-flipping example in the pre-lecture reading).
- Total variation distance.
- Difference in group means.
Next time
Identifying different ways in which data can be missing. Don't worry, hypothesis testing will be revisited!