Histogram
df.plot(kind='hist', y=data_col, bins=the_bins, density=True, ec='w')
Creates a histogram using a DataFrame.
- Input:
- kind : string
- To create a histogram, use kind='hist'
- y : label
- Column to calculate frequency/probability density.
- bins : integer or array, default None
- If integer, number of bins to use.
- If array, specifies the bin edges.
- If not specified, matplotlib tries to calculate the optimal number of bins.
- density : boolean, default False
- If False, y-axis plots the number of observations.
- If True, y-axis plots the probability density.
- ec : string
- Color for histogram bin outlines, use ec='w' for a white outline.
- Returns:
- Matplotlib plot created using parameters.
- Return Type:
- Matplotlib plot
- Note:
- In a histogram, only the last bin is inclusive of the right endpoint! [left, right)
- The bins you specify don't have to include all data values; data values not in any bin won't be shown in the histogram.
The diagram below provides a visualization of how histograms are formed. For additional helpful visual guides, please visit the Diagrams site.
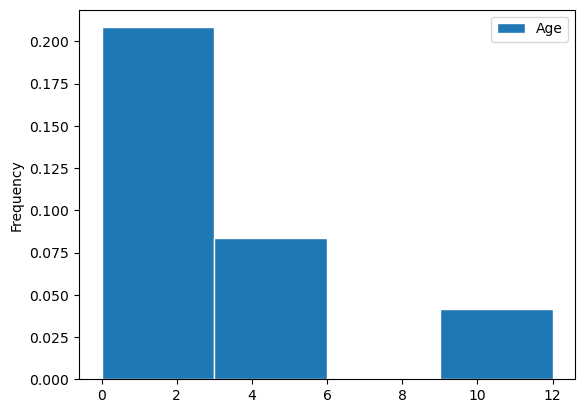
pets.plot(kind='hist', y='Age', bins=np.arange(0, 15, 3), density=True, ec='w')
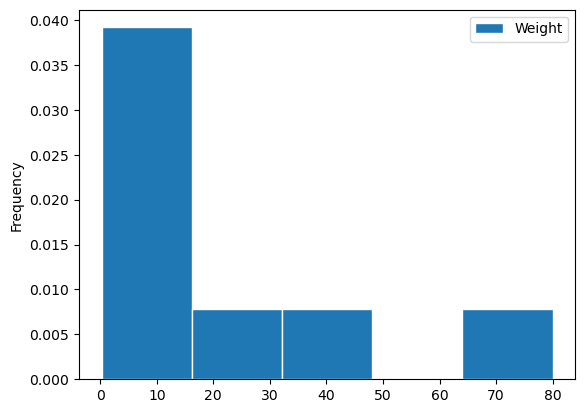
pets.plot(kind='hist', y='Weight', bins=5, density=True, ec='w')
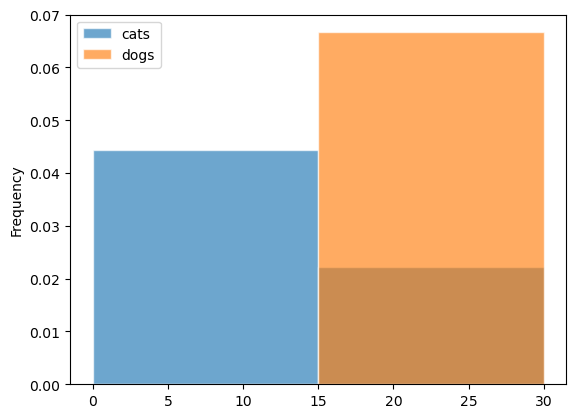
# DataFrame with weights of only cats and dogs.
cats_dogs = bpd.DataFrame().assign(
    cats=np.array(pets[pets.get('Species') == 'cat'].get('Weight')),
    dogs=np.array(pets[pets.get('Species') == 'dog'].get('Weight')),
)

# Overlaid histogram.
bins = np.arange(0, 40, 15)
cats_dogs.plot(kind='hist', alpha=0.65, density=True, ec='w', bins=bins)
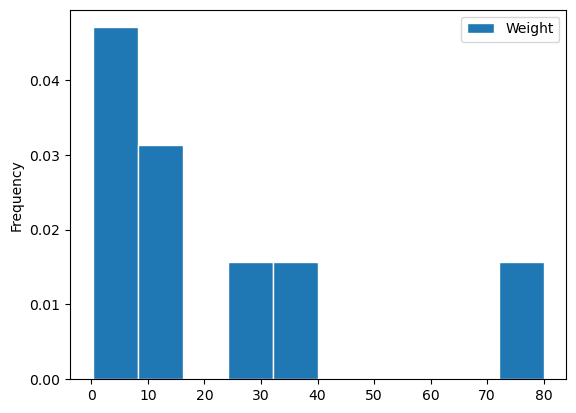
# Without the `bins` parameter.
pets.plot(kind='hist', y='Weight', density=True, ec='w')
See Also
[Bar Plot](../plotting/Bar Plot.md) · np.arange()
Problems or suggestions about this page? Fill out our feedback form.