Permutation Test
Concept
We use a permutation test to test whether two samples are drawn from the same population.
Permutation: A permutation of a sequence is a rearrangement of the elements in that sequence.
- Example: 'BAC' and 'CAB' are both permutations of the string 'ABC'.
- We create permutations by shuffling.
Permutation tests: A permutation test is a type of A/B test (and a type of hypothesis test). It tests whether two samples come from the same population distribution. To conduct a permutation test:
- Shuffle the group labels (i.e. the Trues and Falses) to generate two new samples under the null.
- Compute the test statistic (i.e. the difference in group means).
- Repeat steps 1 and 2 to generate an empirical distribution of the test statistics (i.e. the difference in group means).
- See where the observed statistic lies in the empirical distribution. If, in our simulations, we rarely saw a difference in group means as extreme as the observed difference in group means, we have evidence to reject the null.
While shuffling, the size of the two new samples should be the same as the observed samples.
The diagram below provides an overview of conducting a permutation test, although it references a different dataset. Here is another useful visualization. For additional helpful visual guides, please visit the Diagrams site.
Code Example (Absolute Difference)
1. State the question/hypothesis
We will test the following pair of hypotheses at the standard p = 0.05 significance level:
- Null Hypothesis: In the population, weights of dogs and cats have the same distribution, and the observed differences in our samples are due to random chance.
- Alternative Hypothesis: In the population, dogs and cats have different weights, on average. The observed differences in our samples cannot be explained by random chance alone.
Since the alternative hypothesis is of the form "A and B are different," the test statistic should measure distance and use an absolute value.
We use absolute difference in group means as the test statistic.
2. Query the DataFrame
Since we want to compare the distributions of only cats and dogs, we need to make sure to only include the relevant pieces of data (e.g., cats and dogs weights).
# Create a boolean Series that references which rows fulfill either condition.
querying_condition = (full_pets.get('Species') == 'dog') | (full_pets.get('Species') == 'cat')
# Query.
cats_dogs = full_pets[querying_condition]
# Display the first 5 rows only.
cats_dogs.take(np.arange(5))
| Index | ID | Species | Color | Weight | Age | Is_Cat | Owner_Comment |
|---|---|---|---|---|---|---|---|
| 0 | dog_001 | dog | black | 40 | 5 | False | There are no bad dogs, only bad owners. |
| 1 | cat_001 | cat | golden | 1.5 | 0.2 | True | My best birthday present ever!!! |
| 2 | cat_002 | cat | black | 15 | 9 | True | ****All you need is love and a cat.**** |
| 3 | dog_002 | dog | white | 80 | 2 | False | Love is a wet nose and a wagging tail. |
| 4 | dog_003 | dog | black | 25 | 0.5 | False | Be the person your dog thinks you are. |
3. Create a function to calculate test statistic
Since our hypotheses depend on the test statistic, create a function to be able to calculate it during every trial of our permutation test.
def difference_in_means(cats_dogs):
    """
    Calculate the absolute difference in the mean weight of dogs and cats.
    ---
    Input:
        cats_dogs: a DataFrame containing the columns 'Species' and 'Weight'.
    ---
    Output:
        The absolute difference in the mean weight of dogs and cats.
    """
    means = cats_dogs.groupby('Species').mean()
    return np.abs((means.get('Weight').loc['dog'] - means.get('Weight').loc['cat']))
Note: Although we can simply do this in the for-loop shown in the next step, we can practice good coding habits by separating our code into readable bits!
4. Simulate the permutation test
n = 500 # Number of simulations.
statistics = np.array([]) # Array to keep track of the difference in means for each iteration.
for i in np.arange(n): # Run the simulation `n` number of times
    # 1. Shuffle the species.
    shuffled = cats_dogs.assign(Species=np.random.permutation(cats_dogs.get('Species')))

    # 2. Compute the test statistic.
    statistic = difference_in_means(shuffled)

    # 3. Save the result.
    statistics = np.append(statistics, statistic)
This code will run the permutation test 500 times, but a different reasonable number can be used instead. It is crucial to keep track of the difference in means each time our for-loop runs so that the number of simulated values can be displayed.
5. Conclusion
observed = difference_in_means(cats_dogs)
p_value = np.count_nonzero(statistics >= observed) / n

print("The observed value of the test statistic is:", observed)
print("The p-value is:", p_value)
The observed value of the test statistic is: 30.361111111111107
The p-value is: 0.004
Using a significance level of 0.05:
- Under the null hypothesis, we rarely see a difference greater than the observed value.
- Therefore, we reject the null hypothesis: the evidence implies that the two groups do not come from the same distribution.
- Still, we cannot conclude that species causes a different weight because there may be other confounding variables.
6. Extra
Let's see how our observed statistic compares to the overall simulated values!
# Create the histogram.
bpd.DataFrame().assign(statistics=statistics).plot(kind='hist', bins=20, density=True, ec='w')
# Don't worry about this line - you won't need to know it for this course!
plt.axvline(x=observed, c='black', linewidth=4, label='population difference in means')
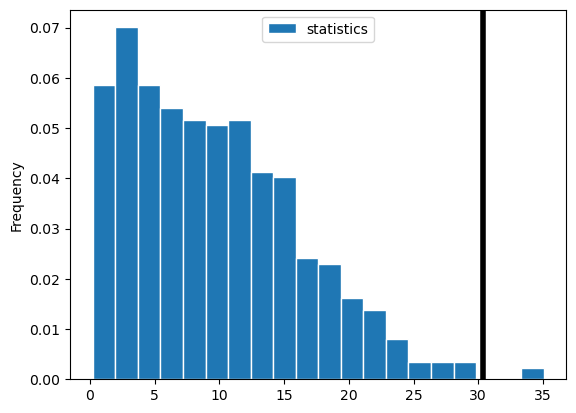
From this graph, we can tell that there is barely any data to the right of the black vertical line (our observed statistic), meaning we have a very low p-value!
Problems or suggestions about this page? Fill out our feedback form.