The Standard Normal Distribution
Concept
The standard normal distribution is a normal distribution with mean 0, standard deviation 1, and inflection points at ±1. The shape of the the standard normal distribution is called the standard normal curve or bell curve.
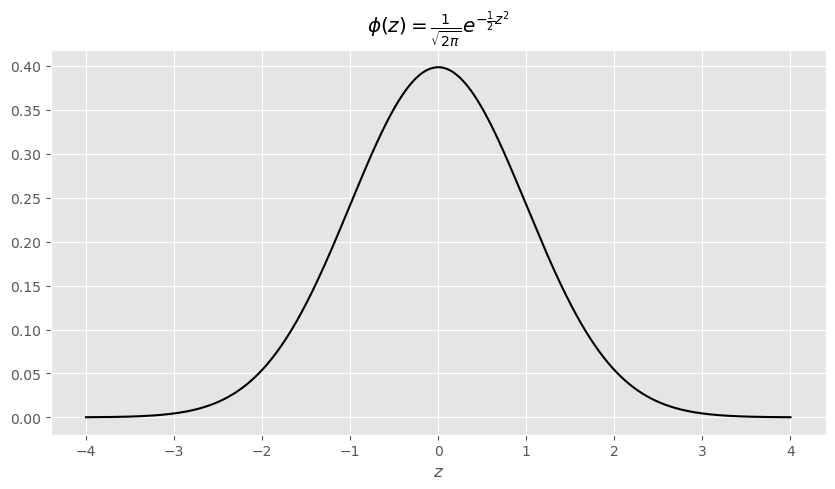
This is what the standard normal distribution curve looks like. Don't worry about the formula at the top.
- The area under the standard normal curve is always equal to 1.
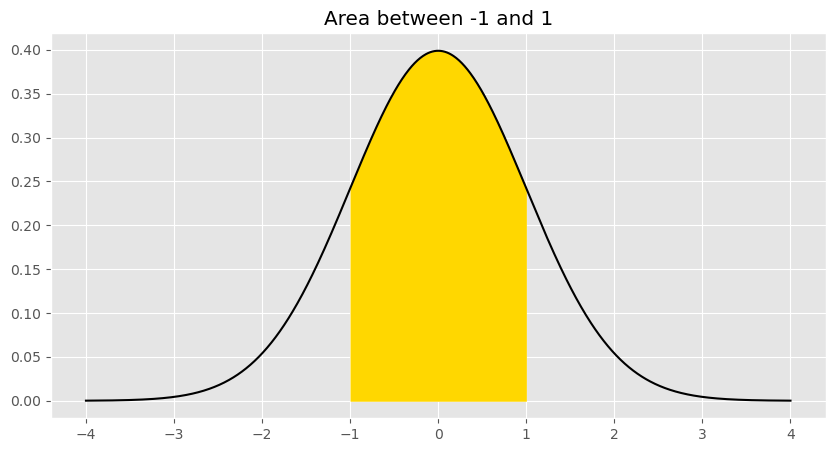
- The area between any values a and b is the proportion of values between a and b.
- The x-axis in a plot of the standard normal distribution is in standard units.
Cumulative Density Function (CDF): a function that takes in a value z and returns the proportion of values in the distribution that are less than or equal to z.
- Also known as the area under the curve to the left of z.
Inflection Point: where a curve goes from "opening down" 🙁 to "opening up" 🙂.
- The standard normal curve has inflections points at 1 and -1.
68–95–99.7 rule: states that 68% of the data under the standard normal distribution falls within 1 standard deviation above and below the mean, 95% within 2 standard deviations, and 99.7% within 3 standard deviations.
Inflection Points Visualized
As you can see, the inflection points on a bell curve occur at 1 and -1.
Finding Areas Under the Standard Normal Curve
Find the area under the standard normal curve from -∞ to z.
scipy.stats.norm.cdf(z)
Find the area under the standard normal curve from z_1 to z_2.
scipy.stats.norm.cdf(z_2) - scipy.stats.norm.cdf(z_1)
Examples in Python:
print("Area from -inf to -1:", scipy.stats.norm.cdf(-1))
Area from -inf to -1: 0.15865525393145707
This means that 15.865% of the data in a standard normal curve falls to the left of 1 standard deviation below the mean.
print("Area from -inf to 0:", scipy.stats.norm.cdf(0))
Area from -inf to 0: 0.5
This means that 50% of the data in a standard normal curve falls to the left of the mean.
print("Area from -1 to 1:", scipy.stats.norm.cdf(1) - scipy.stats.norm.cdf(-1))
Area from -1 to 1: 0.6826894921370859
This means that 68.27% of the data in a standard normal curve falls between 1 standard deviation above and below the mean, as stated in the 68-95-99.7 rule.
Problems or suggestions about this page? Fill out our feedback form.